Pages

Sunday, 8 December 2013

Climate myths translated into econ talk

Yesterday, I was at an amazing meeting. The three public lectures about climatology were not that eventful, although it was interesting to see how you can present the main climatological findings in a clear way.

The amazing part was the Q&A afterwards. I was already surprised to see that I was one of the youngest ones, but had not anticipated that most of these people were engineers and economists, that is climate ostriches. As far as I remember, not one public question was interesting! All were trivially nonsense, I am sorry to have to write.

One of the ostriches showed me some graphs from a book by Fred Singer. Maybe I should go to an economics conference and cite some mercantile theorems of Colbert. I wonder how they would respond.

Afterwards I wondered whether translating their "arguments" against climatology to economy would help non-climatologists to see the weakness of the simplistic arguments. This post is a first attempt.

Seven translations

#1. That there is and always have been natural variability is not an argument again anthropogenic warming just like the pork cycle does not preclude economic growth.

#2. One of our economist ostriches thought that there was no climate change in Germany because one mountain station shows cooling. That is about as stupid as claiming that there is no economic growth because one of your uncles had a decline in his salary.

#3. The claim that the temperature did not increase or that it was even cooling in the last century, that it is all a hoax of climatologists (read the evil Phil Jones) can be compared to a claim that the world did not get wealthier in the last century and that all statistics showing otherwise are a government cover-up. In both cases there are so many independent lines of research showing increases.

#4. The idea that CO2 is not a greenhouse gas and that increases in CO2 cannot warm the atmosphere is comparable to people claiming that their car does not need energy and that they will not drive less if gasoline becomes more expensive. Okay maybe this is not the best example, most readers will likely claim that gas prices have no influence on them, they have no choice and have to drive, but I would hope that economists know better. The strength of both effects needs study, but to suggest that there is no effect is beyond reason.

#5. Which climate change are you talking about, it stopped in 1998. That would be similar to the claim that since the banking crisis in 2008 markets are no longer efficient. Both arguments ignore the previous increases and deny the existence of variability.

#6. The science isn't settled. Both science have foundations that are broadly accepted in the profession (consensus) and problems that are not clear yet and that are a topic of research.

#7. The curve fitting exercises without any physics by the ostriches are similar to "technical analyses" of stock ratings.

[UPDATE. Inspired by a comment of David in the comments of Judith Curry on Climate Change (EconTalk)
#8 The year 1998 was a strong El Nino year and way above trend, well above nearby years. Choosing that window is similar to saying that stocks are a horrible investment because the market collapsed during the Great Depression.]

[UPDATE. Found a nice one.
Daniel Barkalow writes:
Looking at the global average surface temperature (which is what those graphs tend to show), is a bit like looking at someone's bank account. It's a pretty good approximation of how much money they have, but there's going to be a lot of variability, based on not knowing what outstanding bills the person has, and the person is presumably earning income continuously, but only getting paychecks at particular times. This mostly averages out, but there's the risk in looking at any particular moment that it's a really uncharacteristic moment.

In particular, it seems to me that the "pause" idea is based on the fact that 1998 was warmer than nearly every year since, while neglecting that 1998 was warmer than 1997 or any previous year by more than 15 years of predicted warming. If this were someone's bank account, we'd guess that it reflected an event like having their home purchase fall through after selling their old home: some huge asset not usually included ended up in their bank account for a certain period before going back to wherever it was. You wouldn't then think the person had stopped saving, just because they hadn't saved up to a level that matches when their house money was in their bank account. You'd say that there was weird accounting in 1998, rather than an incredible gain followed by a mysterious loss.
]


One interesting question

The engineers and economists were wearing suits and the scientists were dressed more casually. Thus it was easy to find each other. One had an interesting challenge, which was at least new to me, he argued that the Fahrenheit scale, which was used a lot in the past is uncertain because it depends on the melting point of brine and the amount of salt put in the brine will vary.

One would have to make quite an error with the brine to get rid of global warming, however. Furthermore, everyone would have had to make the same error, because a random errors would average out. And if there were a bias, this would be reduced by homogenization. And almost all of the anthropogenic warming was after the 1950-ies, where this problem no longer existed.

A related problem is that the definition of the Fahrenheit scale has changed and also that there are many temperature scales and in old documents it is not always clear which unit was used. Wikipedia lists these scales: Celsius, Delisle, Fahrenheit, Kelvin, Newton, Rankine, Réaumur and Rømer. Such questions are interesting to get the last decimal right, but no reason to become an ostrich.

Disturbing

I find it a bit disturbing that so many economists come up with so simple counter "arguments". They basically assume that climatologists are stupid or are conspiring against humanity. Expecting that for anther field of study makes one wonder where they got that expectation from and shines a bad light on economics.

This was just a quick post, I would welcome ideas for improvements and additions in the comments. Did I miss any interesting analogies?

Thursday, 5 December 2013

Announcement of the 8th Seminar for Homogenization in Budapest in May 2014

The first announcement has been published of the 8th Seminar for Homogenization. This is the main meeting of the homogenization community. It was announced on the homogenization distribution list. Anyone working on homogenization is welcome to join this list.

This time it will be organized together with the 3rd conference on spatial interpolation techniques in climatology and meteorology. As always it will be held in Budapest, Hungary. It will take place from the 12th to the 16 May 2014. The pre-registration and abstract submission deadline is 30 March 2014.

[UPDATE: There is now a homepage with all the details about the seminar.]

The announcement is available as PDF. Some excerpts:

Background

At present we plan to organize the Homogenization Seminar and the Interpolation Conference together considering certain theoretical and practical aspects. Theoretically there is a strong connection between these topics since the homogenization and quality control procedures need spatial statistics and interpolation techniques for spatial comparison of data. On the other hand the spatial interpolation procedures (e.g. gridding) need homogeneous, high quality data series to obtain good results, as it was performed in the Climate of Carpathian Region project led by OMSZ and supported by JRC. The main purpose of the project was to produce a gridded database for the Carpathian region based on homogenized data series. The experiences of this project may be useful for the implementation of gridded databases.

Monday, 2 December 2013

On the importance of changes in weather variability for changes in extremes

This is part 2 of the series on weather variability.

A more extreme climate is often interpreted in terms of weather variability. In the media weather variability and extreme weather are typically even used as synonyms. However, extremes may also change due to changes in the mean state of the atmosphere (Rhines and Huybers, 2013) and it is in general difficult to decipher the true cause.

Katz and Brown theorem

Changes in mean and variability are dislike quantities. Thus comparing them is like comparing apples and oranges. Still Katz and Brown (1992) found one interesting general result: the more extreme the event, the more important a change in the variability is relative to the mean (Figure 1). Thus if there is a change in variability, it is most important for the most extreme events. If the change is small, these extreme events may have to be extremely extreme.

Given this importance of variability they state:
"[Changes in the variability of climate] need to be addressed before impact assessments for greenhouse gas-induced climate change can be expected to gain much credibility."

The relative sensitivity of an extreme to changes in the mean (dashed line) and in the standard deviation (solid line) for a certain temperature threshold (x-axis). The relative sensitivity of the mean (standard deviation) is the change in probability of an extreme event to a change in the mean (or standard deviation) divided by its probability. From Katz and Brown (1992).
It is common in the climatological literature to also denote events that happen relatively regularly with the term extreme. For example, the 90 and 99 percentiles are often called extremes even if such exceedances will occur a few times a month or year. Following the common parlance, we will denote such distribution descriptions as moderate extremes, to distinguish them from extreme extremes. (Also the terms soft and hard extremes are used.) Based on the theory of Katz and Brown, the rest of this section will be ordered from moderate to extreme extremes.

Examples from scientific literature

We start with the variance, which is a direct measure of variability and strongly related to the bulk of the distribution. Della-Marta et al. (2007) studied trends in station data over the last century of the daily summer maximum temperature (DSMT). They found that the increase in DSMT variance over Western Europe and central Western Europe is, respectively, responsible for approximately 25% and 40% of the increase in hot days in these regions.

They also studied trends in the 90th, 95th and 98th percentiles. For these trends variability was found to be important: If only changes in the mean had been taken into account these estimates would have been between 14 and 60% lower.

Also in climate projections for Europe, variability is considered to be important. Fischer and Schär (2009) found in the PRUDENCE dataset (a European downscaling project) that for the coming century the strongest increases in the 95th percentile are in regions where variability increases most (France) and not in regions where the mean warming is largest (Iberian Peninsula).

The 2003 heat wave is a clear example of an extreme extreme, where one would thus expect that variability is important. Schär et al. (2004) indeed report that the 2003 heat wave is extremely unlikely given a change in the mean only. They show that a recent increase in variability would be able to explain the heat wave. An alternative explanation could also be that the temperature does not follow the normal distribution.

Tuesday, 26 November 2013

Are break inhomogeneities a random walk or a noise?

Tomorrow is the next conference call of the benchmarking and assessment working group (BAWG) of the International Surface Temperature Initiative (ISTI; Thorne et al., 2011). The BAWG will create a dataset to benchmark (validate) homogenization algorithm. It will mimic the real mean temperature data of the ISTI, but will include know inhomogeneities, so that we can assess how well the homogenization algorithms remove them. We are almost finished discussing how the benchmark dataset should be developed, but still need to fix some details. Such as the question: Are break inhomogeneities a random walk or a noise?

Previous studies

The benchmark dataset of the ISTI will be global and is also intended to be used to estimate uncertainties in the climate signal due to remaining inhomogeneities. These are the two main improvements over previous validation studies.

Williams, Menne, and Thorne (2012) validated the pairwise homogenization algorithm of NOAA on a dataset mimicking the US Historical Climate Network. The paper focusses on how well large-scale biases can be removed.

The COST Action HOME has performed a benchmarking of several small networks (5 to 19 stations) realistically mimicking European climate networks (Venema et al., 2012). It main aim was to intercompare homogenization algorithms, the small networks allowed HOME to also test manual homogenization methods.

These two studies were blind, in other words the scientists homogenizing the data did not know where the inhomogeneities were. An interesting coincidence is that the people who generated the blind benchmarking data were outsiders at the time: Peter Thorne for NOAA and me for HOME. This probably explains why we both made an error, which we should not repeat in the ISTI.

Monday, 25 November 2013

Introduction to series on weather variability and extreme events

This is the introduction to a series on changes in the daily weather and extreme weather. The series discusses how much we know about whether and to what extent the climate system experiences changes in the variability of the weather. Variability here denotes the the changes of the shape of probability distribution around the mean. The most basic variable to denote variability would be the variance, but many other measures could be used.

Dimensions of variability

Studying weather variability adds more dimensions to our apprehension of climate change and also complexities. This series is mainly aimed at other scientists, but I hope it will be clear enough for everyone interested. If not, just complain and I will try to explain it better. At least if that is possible, we do not have much solid results on changes in the weather variability yet.

The quantification of weather variability requires the specification of the length of periods and the size of regions considered (extent, the scope or domain of the data). Different from studying averages is that the consideration of variability adds the dimension of the spatial and temporal averaging scale (grain, the minimum spatial resolution of the data); thus variability requires the definition of an upper and lower scale. This is important in climate and weather as specific climatic mechanisms may influence variability at certain scale ranges. For instance, observations suggest that near-surface temperature variability is decreasing in the range between 1 year and decades, while its variability in the range of days to months is likely increasing.

Similar to extremes, which can be studied on a range from moderate (soft) extremes to extreme (hard) extremes, variability can be analysed by measures which range from describing the bulk of the probability distribution to ones that focus more on the tails. Considering the complete probability distribution adds another dimension to anthropogenic climate change. Such a soft measure of variability could be the variance, or the interquartile range. A harder measure of variability could be the kurtosis (4th moment) or the distance between the first and the 99th percentile. A hard variability measure would be the difference between the maximum and minimum 10-year return periods.

Another complexity to the problem is added by the data: climate models and observations typically have very different averaging scales. Thus any comparisons require upscaling (averaging) or downscaling, which in turn needs a thorough understanding of variability at all involved scales.

A final complexity is added by the need to distinguish between the variability of the weather and the variability added due to measurement and modelling uncertainties, sampling and errors. This can even affect trend estimates of the observed weather variability because improvements in climate observations have likely caused apparent, but non-climatic, reductions in the weather variability. As a consequence, data homogenization is central in the analysis of observed changes in weather variability.

Friday, 22 November 2013

IPCC videos on the working groups The Physical Science Basis and Extremes


The IPCC has just released a video with main points from the IPCC report on the physical basis. Hat tip Klimazwiebel. It is beautifully made and I did not notice any obvious errors, which you can normally not say for journalistic works, unfortunately.

For the typical reader of this blog it may be a bit to superficial. And the people who do not read this blog will likely never see it. Thus I do wonder for whom the video is made. :-)

Another nice video by the IPCC is the one on the special report on Extremes (SREX) published last year. Same caveat.

Sunday, 17 November 2013

On the reactions to the doubling of the recent temperature trend by Curry, Watts and Lucia

The recent Cowtan and Way study, coverage bias in the HadCRUT4 temperature record, in the QJRMS showed that the temperature trend over the last 15 years is more than twice as strong as previously thought. [UPDATE: The paper can be read here it is now Open Access]

This created quite a splash in the blog-o-sphere; see my last post. This is probably no wonder. The strange idea that the global warming has stopped is one of the main memes of the climate ostriches and in the USA even of the main stream media. A recent media analysis showed that half of the reporting of the recent publication of the IPCC report pertained this meme.

This reporting is in stark contrast to the the IPCC having almost forgotten to write about it as it has little climatological significance. Also after the Cowtan and Way (2013) paper, the global temperature trend between 1880 and now is still about 0.8 degrees per century.

The global warming of the entire climate system is continuing without pause in the warming of the oceans. While the oceans are the main absorber of energy in the climate system. The atmospheric temperature increase only accounts for about 2 percent of the total. Because the last 15 years also just account for a short part of the anthropogenic warming period, one can estimate that the discussion is about less than one thousandths of the warming.

Reactions

The study was positively received by amongst others the Klimalounge (in German), RealClimate, Skeptical Science, Carbon Brief, QuakeRattled, WottsUpWithThatBlog, OurChangingClimate, Moyhu (Nick Stockes) and Planet 3.0. It is also discussed in the press: Sueddeutsche Zeitung, TAZ, Spiegel Online (three leading newspapers in Germany, in German), The Independent (4 articles), Mother Jones, Hürriyet (a large newspaper in Turkey) and Science Daily.

Lucia at The Blackboard wrote in her first post Cotwan and Way: Have they killed the pause? and stated: "Right now, I’m mostly liking the paper. The issues I note above are questions, but they do do quite a bit of checking". And Lucia wrote in her second post: "The paper is solid."

Furthermore, Steve Mosher writes: "I know robert [Way] does first rate work because we’ve been comparing notes and methods and code for well over a year. At one point we spent about 3 months looking at labrador data from enviroment canada and BEST. ... Of course, folks should double and triple check, but he’s pretty damn solid."

The main serious critical voice seems to be Judith Curry at Climate Etc. Her comments have been taken up by numerous climate ostrich blogs. This post discusses Curry's comments, which were also taken up by Lucia. And I will also include some erroneous additions by Antony Watts. And it will discuss one one additional point raised by Lucia.
  1. Interpolation
  2. UAH satellite analyses
  3. Reanalyses
  4. No contribution
  5. Model validation
  6. A hiatus in the satellite datasets (Black Board)

Wednesday, 13 November 2013

Temperature trend over last 15 years is twice as large as previously thought

UPDATED: Now with my response to Juddith Curry's comments and an interesting comment by Peter Thorne.

Yesterday a study appeared in the Quarterly Journal of the Royal Meteorological Society that suggests that the temperature trend over the last 15 years is about twice a large as previously thought. This study [UPDATE: Now Open Access] is by Kevin Cowtan and Robert G. Way and is called: "Coverage bias in the HadCRUT4 temperature series and its impact on recent temperature trends".

The reason for the bias is that in the HadCRUT dataset, there is a gap in the Arctic and the study shows that it is likely that there was strong warming in this missing data region (h/t Stefan Rahmstorf at Klimalounge in German; the comments and answers by Rahmstorf there are also interesting and refreshingly civilized; might be worth reading the "translation"). In the HadCRUT4 dataset the temperature trend over the period 1997-2012 is only 0.05°C per decade. After filling the gap in the Arctic, the trend is 0.12 °C per decade.

The study starts with the observation that over the period 1997 to 2012 "GISTEMP, UAH and NCEP/NCAR [which have (nearly) complete global coverage and no large gap at the Arctic, VV] all show faster warming in the Arctic than over the planet as a whole, and GISTEMP and NCEP/NCAR also show faster warming in the Antarctic. Both of these regions are largely missing in the HadCRUT4 data. If the other datasets are right, this should lead to a cool bias due to coverage in the HadCRUT4 temperature series.".

Datasets

All datasets have their own strengths and weaknesses. The nice thing about this paper is how they combine the datasets and use the strengths and mitigate their weaknesses.

Surface data. Direct (in-situ) measurements of temperature (used in HadCRU and GISTEMP) are very important. Because they lend themselves well to homogenization, station data is temporal consistent and its trend are thus most reliable. Problems are that most observations were not performed with climate change in mind and the spatial gaps that are so important for this study.

Satellite data. Satellites perform indirect measurements of the temperature (UAH and RSS). Their main strengths are the global coverage and spatial detail. A problem for satellite datasets are that the computation of physical parameters (retrievals) needs simplified assumptions and that other (partially unknown) factors can influence the result. The temperature retrieval needs information on the surface, which is especially important in the Arctic. Another satellite temperature dataset by RSS therefore omits the Arctic from their dataset. UAH is also expected to have biases in the Arctic, but does provide data.

Tuesday, 12 November 2013

Has COST HOME (2007-2011) passed without true impact on practical homogenisation?

Guest post by Peter Domonkos, one of the leading figures in the homogenization of climate data and developer of the homogenization method ACMANT, which is probably the most accurate method currently available.

A recent investigation done in the Centre of Climate Change of University Rovira i Virgili (Spain) showed that the ratio of the practical use of HOME-recommended monthly homogenisation methods is very low, namely it is only 8.4% in the studies published or accepted for publication in 6 leading climatic journals in the first half of 2013.

The six journals examined are the Bulletin of the American Meteorological Society, Climate of the Past, Climatic Change, International Journal of Climatology, Journal of Climate and Theoretical and Applied Climatology. 74 studies were found in which one or more statistical homogenisation methods were applied for monthly temperature or precipitation datasets, the total number of homogenisation exercises in them is 119. A large variety of homogenisation methods was applied: 34 different methods have been used, even without making distinction among different methods labelled by the same name (as it is the case with the procedures of SNHT and RHTest). HOME-recommended methods were applied only in 10 cases (8.4%) and the use of objective or semi-objective multiple break methods was even much rare, 3.4% only.

In the international blind test experiments of HOME, the participating multiple break methods produced the highest efficiency in terms of the residual RMSE and trend bias of homogenised time series. (Note that only methods that detect and correct directly the structures of multiple breaks are considered multiple break methods.) The success of multiple break methods was predictable, since their mathematical structures are more appropriate for treating the multiple break problem than the hierarchic organisation of single break detection and correction.

Highlights EUMETNET Data Management Workshop 2013

The Data Management Workshop (DMW) had four main themes: data rescue, homogenization, quality control and data products. Homogenization was clearly the most important topic with about half of the presentations and was also the main reason I was there. Please find below the highlights I expect to be more interesting. In retrospect this post has quite a focus on organizational matters, mainly because this was most new to me.

The DMW is different from the Budapest homogenization workshops in that it focused more on best practices at weather services and Budapest more on the science and the development of homogenization methods. One idea from the workshop is that it may be worthwhile to have a counterpart to the homogenization workshop in the field of quality control.

BREAKING NEWS: Tamas Szentimrey announced that the 8th Homogenization seminar will be organized together with 3rd interpolation seminar in Budapest on 12-16 May 2014.

UPDATE: The slides of many presentations can now be downloaded.

Monday, 4 November 2013

Weather variability and Data Management Workshop 2013 in San Lorenzo de El Escorial, Spain

This week I will be at the Data Management Workshop (DMW) in San Lorenzo de El Escorial. Three fun filled days about data rescue, homogenization, quality control and data products (database). While it is nice weather outside.

It is organized by EUMETNET, a network of 30 European National Meteorological Services. Thus I will be one of the few from a university, as is typical for homogenization. It is a topic of high interest to the weather services.

Most European experts will be there. The last meeting I was at was great. The program looks good. I am looking forward to it.

My contribution to the workshop will be to present a joint review of what we know about inhomogeneities in daily data. Much of this information stems from parallel measurements, in other words from simultaneous measurements with a modern and a historical set-up. We need to know about non-climatic changes in extremes and weather variability, to be able to assess the climatic changes.

The coming time, I hope to be able to blog about some of the topics of this review. It shows that the homogenization of daily data is a real challenge and that we need much more data from parallel measurements to study the non-climatic changes in the probability distribution of daily datasets. Please find our abstract below.

The slides of the presentation can be downloaded here.

Friday, 1 November 2013

Atmospheric warming hiatus: The peculiar debate about the 2% of the 2%

Dana Nuccitelli recently wrote an article for the Guardian and the introduction read: "The slowed warming is limited to surface temperatures, two percent of overall global warming, and is only temporary". As I have been arguing before, how minute the recent deviation of the predicted warming is, my first response was, good that someone finally computed how small.

However, Dana Nuccitelli followed the line of argumentation of Wotts and argued that the atmosphere is just a small part of the climate system and that you do see the warming continue in the rest, mainly in the oceans. He thus rightly sees focusing on the surface temperatures only as a form of cherry picking. More on that below.

The atmospheric warming hiatus is a minor deviation

There is another two percent. Just look at the graph below of the global mean temperature since increases in greenhouse gasses became important.


The anomalies of the global mean temperature of the Global Historical Climate Network dataset versions 3 (GHCNv3) of NOAA. The anomalies are computed of the temperature by subtracting the mean temperature from 1880 to 1899.

The temperature increase we have seen since the beginning of 1900 is about 31 degree years (the sum of the anomalies over all years). You can easily compute that this is about right because the triangle below the temperature curve, with a horizontal base of about 100 years and a vertical size (temperature increase) of about 0.8°C: 0.5*100*0.8=40 degree years; the large green triangle in the figure below. For the modest aims of this post 31 and 40 degree years are both fine values.

The hiatus, the temperature deviation the climate ostriches are getting crazy about, has lasted at best 15 years and has a size of about 0.1°C. Thus using the same triangular approach we can compute that this is 0.5*15*0.1=0.75 degree years; this is the small blue triangle in the figure below.

The atmospheric warming hiatus is thus only 100% * 0.75 / 31 = 2.4% of the total warming since 1900. This is naturally just a coarse estimate of the order of magnitude of the effect, almost any value below 5% would be achievable with other reasonable assumptions. I admit having tried a few combinations before getting the nice matching value for the title.


Monday, 28 October 2013

How to talk to uncle Bob, the climate ostrich

Willard of Never Ending Audit recommended a video on climate communication in the comments at HotWhopper that deserves more attention. In the video George Marshall of talkingclimate.org explains how to talk to climate ostriches, for example by being respectful to climate ostriches. In the video, he is not talking to the fringe ostriches, however, but to the mainstream. Talking about the ostriches the way one talks when they are not in the room, makes the climate ostriches go mad in the comments. I would advice any ostrich with blood pressure problems not to watch this video.

The video is called "How to talk to a climate change denier" and halfway Marshall explains that that term is best avoided in a productive conversation. Furthermore, it is not about the oddish "debate" in the blogosphere, it is about talking to someone you know about climate change. This is why I rename the video to "How to talk to uncle Bob, the climate ostrich". Marshall offers the term "climate dissenter", I personally like "ostrich", it fits to these people denying that climate change is a problem in a wide variety of (conflicting) ways.

The conversations with family and friends are probably the most important discussions, while you might have the tendency to avoid them. You are more likely to convince your uncle Bob as someone who build his internet identity around refuting that climate change is a problem.

Quotes from the video

Are you struggling to find ways of talking to people who simply do not believe that climate change is happening. ... Do I fight it out with them? ... You just laugh it out and let it go. Actually that conversation is really important. The fast majority of people form their views from the social interactions with people around them, with their peers.

Common ground

Do not go into an argument, seek common ground. ... When you think of the times when you have been challenged. And someone has changed your views. Was that an argument that was won or lost? Did you ever at the end of a conversation with someone say: you know what, you were right all along, silly me, I was wrong all over, you are right.

Respect

Okay, I know it is hard to feel much respect for people that ...
They are forming their own views, they are expressing their own views. ... The easy option is to say. Climate change is a huge problem and then not to think about not, not to do anything about it. At least they are engaging. ... Let's respect that quality that they make up their own mind.

Hold your views

It is important that you own your views. Don't make it an argument about an "it". ... Don't seek to undermine their sources of information. That is another discussion about the "it". ... This is again going head to head about the "it".

Your journey

People form their opinions over time, it is a steady process of negotiation. ... So it is important you tell them about the process how you came to your views.

Fits worldview

There is no reason why climate change cannot be a matter of deep concern for conservative people, to traditional people, to old people. ... Try to find ways to talk about it in a way that it concerns about them.

Offer rewards

People who do not believe in climate change nonetheless have very strong values in other areas. They are people who have very strong interest in their community, in their family, in a social life. They'd love to be quite traditional in the sense that they have a very strong sense of identity. ... These are values to speak to.


Thursday, 24 October 2013

Many (new) open-access journals in meteorology and climatology

File:PhD Comics Open Access Week 2012.ogv
9-minute video by PhD Comics explaining open access from WikiMedia.
The journal of the German language meteorological organizations, Meteorologische Zeitschrift, has just announced it will move to full open-access publishing in 2014.
[The] editorial board and editor-in-chief of Meteorologische Zeitschrift (MetZet) are pleased to announce that MetZet will be published as full open access journal from the beginning of the year 2014. All contents of this journal from then on will be freely available to readers. Authors are free to non commercially distribute their articles and to post them on their home pages. MetZet follows with this change the requests of many authors, institutions, and funding organizations.
This was a long term request of mine. MetZet has very high standards and publishes good work. In that respect it would be an honour to publish there. In the past it was even one of the main journals in the field. It published the first climate classification by Köppen. It has articles by Hann, Bjeknes, Angström, Flohn and Ertel. However, I did not publish in MetZet up to now because almost nobody has a subscription to it. Thus after getting through the tough review, who would read the articles had I published there? Now this problem is solved.

Other less well known "national" open journals are Időjárás - Quarterly Journal of the Hungarian Meteorological Service (OMSZ) and the Journal of the Catalan Association of Meteorology Tethys. Also Tellus A: Dynamic Meteorology and Oceanography and Tellus B: Chemical and Physical Meteorology have changed to open-access in 2012.

Then we have the IOP journal Environmental Research Letters and the new Elsevier journal Weather and Climate Extremes. Copernicus, the publisher of the European Geophysical Union, has many more open access journals. The most important ones for meteorologists and climatologists are likely:

[UPDATE. O. Bothe has written a more up to date list with open-access journals (October 2014)]

Bad journals

Not all open-access journals are good. Jeffrey Beale even keeps a list of predatory publishers and journals.

Wednesday, 16 October 2013

Does a body composition scale provide independent information? Two experiments: weight and age

Since the beginning of the year I have gained about 8 kg. Was that fat, muscle, water? Probably some of all. My body fat scale estimates that my body fat percentage has increased by about 3%, which would be 2 to 3 kg of fat.

The problem

My problem? My scale knows my weight gain and likely uses my weight to estimate my body fat percentage. If it would not use my weight to estimate body fat, why would it want to know my height (body mass index, BMI), age and sex? Part of the information on body fat likely comes from the currents send through my body by the scale, but another part from my weight or BMI. Thus my problem is, does the increase in body fat percentage tell me more than what I already knew, that I have gained 8 kg?

The experiment

Now luckily, my fitness studio has another instrument to measure body fat. It is attached to a computer and also wants to know my weight. But here, you have to type in. Thus with this instrument you can experiment.

The instrument has a infra-red sensor that has to be placed on your biceps. To compute your body fat, and a colorful page full of other probably highly reliable information, it uses your weight, height, age and fitness.

We made one measurement stating my real current weight and one stating my weight at the beginning of the year. The difference in computed body fat percentage: 3,3%! Almost to similar to the increase estimated by my scale to be true.

The interpretation

It is possible, I gained some fat and my waist did increase some. It is also possible that nothing happened fatwise, other places look more muscular nowadays. I guess all I know is that I gained 8 kg.

I guess this does not surprise scientists and engineers working on these measurement devises. The German Wikipedia even mentions this effect qualitatively. But I am not sure if all users are aware of this problem and we can now put a number on it. If your fat gain is less than a third of your weight gain, the measurement is too uncertain to determine whether there really was a fat gain.

Post Scriptum. We forgot one experiment. I would love to know what the estimate for my body fat percentage would be if I tell the computer I am a young man. I expect some age discrimination by the multiple linear regression equations used.

Post Post Scriptum. Thanks to Caro of Stangenliebe (Pole art fitness Bonn) for the measurement.

UPDATE. I realised I could do the experiment with my age using my own scale. My Soehnle scale has two presets. I set person 1 to my age (rounded to 42) and person 2 to an Adonis of 18 years. In all four measurements the Adonis has exactly 3.7% fat less. If only my age group would not be so overweight, my readings would be a lot better.

Monday, 30 September 2013

Reviews of the IPCC review

The first IPCC report (Working Group One), "Climate Change 2013, the physical science basis", has just been released.

One way to judge the reliability of a source, is to see what it states about a topic you are knowledgeable about. I work on homogenization of station climate data and was thus interested in the question how well the IPCC report presents the scientific state-of-the-art on the uncertainties in trend estimates due to historical changes in climate monitoring practices.

Furthermore, I have asked some colleague climate science bloggers to review the IPCC report on their areas of expertise. You find these reviews of the IPCC review report at the end of the post as they come in. I have found most of these colleagues via the beautiful list with climate science bloggers of Doug McNeall.

Large-Scale Records and their Uncertainties

The IPCC report is nicely structured. The part that deals with the quality of the land surface temperature observations is in Chapter 2 Observations: Atmosphere and Surface, Section 2.4 Changes in Temperature, Subsection 2.4.1 Land-Surface Air Temperature, Subsubsection 2.4.1.1 Large-Scale Records and their Uncertainties.

The relevant paragraph reads (my paragraph breaks for easier reading):
Particular controversy since AR4 [the last fourth IPCC report, vv] has surrounded the LSAT [land surface air temperature, vv] record over the United States, focussed upon siting quality of stations in the US Historical Climatology Network (USHCN) and implications for long-term trends. Most sites exhibit poor current siting as assessed against official WMO [World Meteorological Organisation, vv] siting guidance, and may be expected to suffer potentially large siting-induced absolute biases (Fall et al., 2011).

However, overall biases for the network since the 1980s are likely dominated by instrument type (since replacement of Stevenson screens with maximum minimum temperature systems (MMTS) in the 1980s at the majority of sites), rather than siting biases (Menne et al., 2010; Williams et al., 2012).

A new automated homogeneity assessment approach (also used in GHCNv3, Menne and Williams, 2009) was developed that has been shown to perform as well or better than other contemporary approaches (Venema et al., 2012). This homogenization procedure likely removes much of the bias related to the network-wide changes in the 1980s (Menne et al., 2010; Fall et al., 2011; Williams et al., 2012).

Williams et al. (2012) produced an ensemble of dataset realisations using perturbed settings of this procedure and concluded through assessment against plausible test cases that there existed a propensity to under-estimate adjustments. This propensity is critically dependent upon the (unknown) nature of the inhomogeneities in the raw data records.

Their homogenization increases both minimum temperature and maximum temperature centennial-timescale United States average LSAT trends. Since 1979 these adjusted data agree with a range of reanalysis products whereas the raw records do not (Fall et al., 2010; Vose et al., 2012a).

I would argue that this is a fair summary of the state of the scientific literature. That naturally does not mean that all statements are true, just that it fits to the current scientific understanding of the quality of the temperature observations over land. People claiming that there are large trend biases in the temperature observations, will need to explain what is wrong with Venema et al. (an article of mine from 2012) and especially Williams et al. (2012). Williams et al. (2012) provides strong evidence that if there is a bias in the raw observational data, homogenization can improve the trend estimate, but it will normally not remove the bias fully.

Personally, I would be very surprised if someone would find substantial trend biases in the homogenized US American temperature observations. Due to the high station density, this dataset can be investigated and homogenized very well.

Friday, 27 September 2013

AVAAZ petition to Murdoch to report the truth about climate change


AVAAZ is a digital civil rights organisation, whose petitions and actions have influenced many important political decisions in the last few years.

Because, the summary for policy makers of the new IPCC report is published today, they are now organising a petition asking Rupert Murdoch to report the truth about climate change. The petition just started; they already have half a million signatures after one day.

To Rupert Murdoch:

The scientific consensus that human activities are causing dangerous climate is overwhelming, yet your media outlets around the world continue to seed doubt and spread inaccuracy. Any journalism that does not first acknowledge the evidence that humans are causing this problem is dangerous and irresponsible. As concerned citizens we call on you to tell the truth about man made climate change and report on what we must do to solve this problem.

You can sign this petition here. Please spread the word.

Tuesday, 10 September 2013

NoFollow: Do not give WUWT & Co. unintentional link love


The hubris at WUWT.
Do you remember the search engine AltaVista? One reason it was overrun by Google, was that Google presented the most popular homepages at the top. It did so by analysing who links to who. Homepages that receive many links are assumed to be more popular and get a better PageRank, especially when the links come from homepages with a high PageRank.

The idea behind this is that a link is a recommendation. However, this is not always the case. When I link to WUWT, it is just so that people can easily check that what I claim WUWT has written is really actually there. It is definitely not a recommendation to read that high-quality science blog. To the readers this will be clear, but Google's algorithm does not understand the text, it cannot distinguish popularity from notoriety.

This creates a moral dilemma. Do you link to a source of bad information or not? To resolve this dilemma, and make linking to notorious pages less problematic, Google has introduce a new HTML-tag:

<a href="" rel="nofollow">Some homepage</a>.

If you add NoFollow to a link, Google will not follow the link and not interpret the link as a recommendation in its PageRank computation.

Skeptical sunlight

We are not the only ones with this problem. Many scientifically minded people have this problem, especially people from skeptical societies. Note, that here the word skeptical is used in the original meaning. From them I have this beautiful quote:
As Louis Brandeis famously said, "sunlight is the best disinfectant". Linking directly to misinformation on the web and explaining why it is wrong is like skeptical sunlight. ...

I think the correct way to proceed is to continue providing skeptical sunlight through direct linking. For one thing this demonstrates that we are not afraid of those who we oppose. In general they don’t link back to us, and that demonstrates something to casual readers who take note of it. ...

But while we are doing this we must be constantly vigilant of the page rank issue. Page ranking in Google is vitally important to those who are pushing misinformation on the web. It is how they attract new customers to their vile schemes, whether they be psychics or astrologers or homeopaths or something else. Even if we as skeptics are providing only a miniscule fraction of a misinformation peddler’s page rank, that fraction is too much.
Our links are probably the smallest part, but they may be important nonetheless. These links connect the climate ostrich pages with the main stream. Without our links, their network may look a lot more isolated. This is also important, PageRank is not just about links, but about links from authoritative sources.

If you search in Google using:

link:www.wattsupwiththat.com

You will find many pages linking to WUWT that most likely do not want to promote the disinformation, on the contrary.

Wednesday, 4 September 2013

Proceedings of the Seventh Seminar for Homogenization and Quality Control in Climatological Databases published

The Proceedings of the Seventh Seminar for Homogenization and Quality Control in Climatological Databases jointly organized with the Meeting of Cost ES0601 (Home) Action MC Meeting (Budapest, Hungary, 24-27 October 2011) has now been published. These proceedings were edited by Mónika Lakatos, Tamás Szentimrey and Enikő Vincze.

It is published as a WMO report in the series on World Climate Data and Monitoring Programme. (Some figures may not be displayed right in your browser, I could see them well using Acrobat Reader as stand-alone application and they did print right.)

Monday, 12 August 2013

Anthony Watts calls inhomogeneity in his web traffic a success

[UPDATE. Dec. 2013. The summary of 2013 of WUWT has just been released and the number of pageviews of WUWT has dropped. In 2012 WUWT had 36 million page views, in 2013 only 35 million. Not a large drop, but a good beginning. And it should be noted that a constant readership leads to reductions in ranking as the internet is still growing fast. Thus these number are a clear contrast to the increases in ranking that Anthony Watts announced below.

This confirms that WUWT does not only gives bad information on climate science. Let's hope more people will realize how unreliable WUWT is and start reading real science blogs.]

Success


Anthony Watts pretends to be beside himself with joy. WUWT has an enormous increase in traffic!! In his post Announcement: WUWT success earns an invitation to “Enterprise” he writes: "You are probably aware of the ongoing improvements to WUWT I’ve made. They seem to be paying off. Lately, things have been looking up for WUWT:" and shows this graph.


With such an increase in the quantity of readers, why care about quality? Thus suddenly it is no longer a problem that Wotts Up With That Blog (now called: And Then There's Physics) clarifies the serious errors on WUWT daily.


Comments

The WUWT regulars are cheering.
JimS: Congrats, Anthony Watts. I see that your blog stats have arisen to the level that the AGW alarmists wished the temperatures would also arise to confirming their folly.
John Whitman: The extraordinary ranking of your venue is the best kind of positive energy feedback loop to increase stimulation of critical independent thinkers in every country. You and everyone of them can draw rejuvenating intellectual energy from it. Wow.
George Lawson: The AGW crowd will see this as another nail in their coffin! Almost as painful as this year’s Arctic ice melt.
Stephen Brown: Congratulations! I bet that the rise and rise of WUWT is causing a certain amount of underwear wadding amongst the Warmistas!

Increase?

But is the number of WUWT readers really increasing?

A first indication that this is not the case, is that Anthony Watts did not really write it explicitly. His post and the plot certainly suggest it and he did not correct the people commenting that clearly thought so, but Watts did not explicitly write so. That should make one suspicious.

A second indication is that Watts is very touchy about it. When Collin Maessen, as someone working in IT, pointed out to Watts on Twitter that, Alexa is not very reliable, the response is that Watts blocks Maessen on Twitter.


Friday, 2 August 2013

Tamsin Edwards, what is advocacy?

Tamsin Edwards has started a discussion on advocacy by scientists. A nice topic where everyone can join in and almost everyone has joined in. While I agree with the letter of of her title: Climate scientists must not advocate particular policies, I do not agree with the spirit.

If you define a climate scientist as a natural scientist that studies the climate, it is clear that such a scientist is not a policy expert. Thus when such a scientist has his science hat on, he is well advised not to talk about policy.

However, as private citizen also a climatologist naturally has freedom of expression; I will keep on blogging on topics I am not an expert on, including (climate) policy.

Other scientists may be more suited to give policy advice (answer questions from the politicians or the public on consequences of certain policies) or even to advocate particular policies (develop and communicate a new political strategy to solve the climate problem). Are hydrologists, ecologists, geographers and economists studying climate change impacts climatologists? They surely would have more to say about the consequences of certain policies.

Some scientists focus their work on policy. If that is mainly about climate policy, does that make the following people climatologists? They are certainly qualified to publicly talk about climate policy.

For example, Roger Pielke Jr., with his Masters degree in public policy and a Ph.D. in political science. I guess he will keep on making policy recommendations.
Gilbert E. Metcalf and colleagues (2008) studied carbon taxes in their study, Analysis of U.S. Greenhouse Gas Tax Proposals and probably did not do this to have their study disappear in an archive.
Wolfgang Sterk of the Wuppertal Institut suggests to change the global cap-and-trade discussion to jointly stimulating innovation towards a sustainable economy (unfortunately in German). Sounds close to my suggestion to break the deadlock in the global climate negotiations.

Science and politics

One thing should be clear, science and politics are two different worlds. Politics is about comparing oranges and apples, building coalitions for your ideas and balancing conflicts of interest. Politicians are used to deal with ambiguity and an uncertain future.

Natural science is about comparing like with like. However, you cannot add up lives, health, money and quality of life. Science can say something about implications (including error bars) of a policy with respect to lives, health, money and maybe even quality of life if you define it clearly. The politician will have to weight these things against each other. Science is also about solving clear crisp problems or dividing a complex problem in multiple such simple solvable ones.

Friday, 19 July 2013

Statistically interesting problems: correction methods in homogenization

This is the last post in a series on five statistically interesting problems in the homogenization of climate network data. This post will discuss two problems around the correction methods used in homogenization. Especially the correction of daily data is becoming an increasingly important problem because more and more climatologist work with daily climate data. The main added value of daily data is that you can study climatic changes in the probability distribution, which necessitates studying the non-climatic factors (inhomogeneities) as well. This is thus a pressing, but also a difficult task.

The five main statistical problems are:
Problem 1. The inhomogeneous reference problem
Neighboring stations are typically used as reference. Homogenization methods should take into account that this reference is also inhomogeneous
Problem 2. The multiple breakpoint problem
A longer climate series will typically contain more than one break. Methods designed to take this into account are more accurate as ad-hoc solutions based single breakpoint methods
Problem 3. Computing uncertainties
We do know about the remaining uncertainties of homogenized data in general, but need methods to estimate the uncertainties for a specific dataset or station
Problem 4. Correction as model selection problem
We need objective selection methods for the best correction model to be used
Problem 5. Deterministic or stochastic corrections?
Current correction methods are deterministic. A stochastic approach would be more elegant

Problem 4. Correction as model selection problem

The number of degrees of freedom (DOF) of the various correction methods varies widely. From just one degree of freedom for annual corrections of the means, to 12 degrees of freedom for monthly correction of the means, to 120 for decile corrections (for the higher order moment method (HOM) for daily data, Della-Marta & Wanner, 2006) applied to every month, to a large number of DOF for quantile or percentile matching.

What is the best correction method depends on the characteristics of the inhomogeneity. For a calibration problem just the annual mean would be sufficient, for a serious exposure problem (e.g. insolation of the instrument) a seasonal cycle in the monthly corrections may be expected and the full distribution of the daily temperatures may need to be adjusted.

The best correction method also depends on the reference. Whether the variables of a certain correction model can be reliably estimated depends on how well-correlated the neighboring reference stations are.

Currently climatologists choose their correction method mainly subjectively. For precipitation annual correction are typically applied and for temperature monthly correction are typical. The HOME benchmarking study showed these are good choices. For example, an experimental contribution correcting precipitation on a monthly scale had a larger error as the same method applied on the annual scale because the data did not allow for an accurate estimation of 12 monthly correction constants.

One correction method is typically applied to the entire regional network, while the optimal correction method will depend on the characteristics of each individual break and on the quality of the reference. These will vary from station to station and from break to break. Especially in global studies, the number of stations in a region and thus the signal to noise ratio varies widely and one fixed choice is likely suboptimal. Studying which correction method is optimal for every break is much work for manual methods, instead we should work on automatic correction methods that objectively select the optimal correction method, e.g., using an information criterion. As far as I know, no one works on this yet.

Problem 5. Deterministic or stochastic corrections?

Annual and monthly data is normally used to study trends and variability in the mean state of the atmosphere. Consequently, typically only the mean is adjusted by homogenization. Daily data, on the other hand is used to study climatic changes in weather variability, severe weather and extremes. Consequently, not only the mean should be corrected, but the full probability distribution describing the variability of the weather.

Monday, 15 July 2013

WUWT not interested in my slanted opinion

Today Watts Up With That has a guest post by Dr. Matt Ridley. In this post he seems to refer to a story that was debunked more than a year ago:
And this is even before you take into account the exaggeration that seemed to contaminate the surface temperature records in the latter part of the 20th century – because of urbanisation, selective closure of weather stations and unexplained “adjustments”. Two Greek scientists recently calculated that for 67 per cent of 181 globally distributed weather stations they examined, adjustments had raised the temperature trend, so they almost halved their estimate of the actual warming that happened in the later 20th century.
I tried to direct those WUWT readers that are interested in both sides of the conversation to an old post of mine about why these Greek scientist were wrong and mainly how their study was abused and exaggerated by WUWT.

Naturally, I did not formulate it that way, but in a perfectly neutral way suggested that people could find more information about the above quote as my blog. I see no way my comment could have gone against the WUWT commenting policy. Still the response was:

[sorry, but we aren't interested in your slanted opinion - mod]

Strange, people calling themselves skeptics that are not interested in hearing all sides. I see that some people from WUWT still find their way here to see what the moderator does not allow. Here it is:

Investigation of methods for hydroclimatic data homogenization

(I may remove this redirect in some days, as this post does not really provide any new information.)


UPDATE: Sou at Hotwhopper wrote a post, WUWT comes right out and says "We Aren't Interested" in facts , about his post. Thank you, Sou. So I guess I will have to keep this post up. And that also makes it worthwhile to add another gem to be found in the WUWT guest post of Dr. Matt Ridley.

Wednesday, 10 July 2013

Statistical problems: The multiple breakpoint problem in homogenization and remaining uncertainties

This is part two of a series on statistically interesting problems in the homogenization of climate data. The first part was about the inhomogeneous reference problem in relative homogenization. This part will be about two problems: the multiple breakpoint problem and about computing the remaining uncertainties in homogenized data.

I hope that this series can convince statisticians to become (more) active in homogenization of climate data, which provides many interesting problems.

The five main statistical problems are:
Problem 1. The inhomogeneous reference problem
Neighboring stations are typically used as reference. Homogenization methods should take into account that this reference is also inhomogeneous
Problem 2. The multiple breakpoint problem
A longer climate series will typically contain more than one break. Methods designed to take this into account are more accurate as ad-hoc solutions based single breakpoint methods
Problem 3. Computing uncertainties
We do know about the remaining uncertainties of homogenized data in general, but need methods to estimate the uncertainties for a specific dataset or station
Problem 4. Correction as model selection problem
We need objective selection methods for the best correction model to be used
Problem 5. Deterministic or stochastic corrections?
Current correction methods are deterministic. A stochastic approach would be more elegant

Problem 2. The multiple breakpoint problem

For temperature time series about one break per 15 to 20 years is typical. Thus most interesting stations will contain more than one break. Unfortunately, most statistical detection methods have been developed for one break. To use them on series with multiple breaks, one ad-hoc solution is to first split the series at the largest break (for example the standard normalized homogeneity test, SNHT) and investigate the subseries. Such a greedy algorithm does not always find the optimal solution.

Another solution is to detect breaks on short windows. The window should be short enough to contain only one break, which reduces power of detection considerably.

Multiple breakpoint methods can find an optimal solution and are nowadays numerically feasible. Especially using the optimization methods “dynamic programming”. For a certain number of breaks these methods find the break combination that minimize the internal variance, that is variance of the homogeneous subperiods, (or you could also state that the break combination maximizes the variance of the breaks). To find the optimal number of breaks, a penalty is added that increases with the number of breaks. Examples of such methods are PRODIGE (Caussinus & Mestre, 2004) or ACMANT (based on PRODIGE; Domonkos, 2011). In a similar line of research Lu et al. (2010) solved the multiple breakpoint problem using a minimum description length (MDL) based information criterion as penalty function.


This figure shows a screen shot of PRODIGE to homogenize Salzburg with its neighbors (click to enlarge). The neighbors are sorted based on their cross-correlation with Salzburg. The top panel is the difference time series of Salzburg with Kremsmünster, which has a standard deviation of 0.14°C. The middle panel is the difference between Salzburg and München (0.18°C). The lower panel is the difference of Salzburg and Innsbruck (0.29°C). Not having any experience with PRODIGE, I would read this graph as suggesting that Salzburg probably has breaks in 1902, 1938 and 1995. This fits to the station history. In 1903 the station was moved to another school. In 1939 it was relocated to the airport and in 1996 it was moved on the terrain of the airport. The other breaks are not consistently seen in multiple pairs and may thus well be in another station.

Saturday, 6 July 2013

Five statistically interesting problems in homogenization. Part 1. The inhomogeneous reference problem

This is a series I have been wanting to write for a long time. The final push was last week's conference, the 12th International Meeting Statistical Climatology (IMSC), a very interesting meeting with an equal mix of statisticians and climatologists. (The next meeting in three years will be in the area of Vancouver, Canada, highly recommended.)

At the last meeting in Scotland, there were unfortunately no statisticians present in the parallel session on homogenization. This time it was a bit better. Still it seems as if homogenization is not seen as the interesting statistical problem it is. I hope that this post can convince some statisticians to become (more) active in homogenization of climate data, which provides many interesting problems.

As I see it, there are five problems for statisticians to work on. This post discusses the first one. The others will follow the coming days. UPDATE: they are now linked in the list below.
Problem 1. The inhomogeneous reference problem
Neighboring stations are typically used as reference. Homogenization methods should take into account that this reference is also inhomogeneous
Problem 2. The multiple breakpoint problem
A longer climate series will typically contain more than one break. Methods designed to take this into account are more accurate as ad-hoc solutions based single breakpoint methods
Problem 3. Computing uncertainties
We do know about the remaining uncertainties of homogenized data in general, but need methods to estimate the uncertainties for a specific dataset or station
Problem 4. Correction as model selection problem
We need objective selection methods for the best correction model to be used
Problem 5. Deterministic or stochastic corrections?
Current correction methods are deterministic. A stochastic approach would be more elegant

Problem 1. The inhomogeneous reference problem

Relative homogenization

Statisticians often work on absolute homogenization. In climatology relative homogenization methods, which utilize a reference time series, are almost exclusively used. Relative homogenization means comparing a candidate station with multiple neighboring stations (Conrad & Pollack, 1950).

There are two main reasons for using a reference. Firstly, as the weather at two nearby stations is strongly correlated, this can take out a lot of weather noise and make it much easier to see small inhomogeneities. Secondly, it takes out the complicated regional climate signal. Consequently, it becomes a good approximation to assume that the difference time series (candidate minus reference) of two homogeneous stations is just white noise. Any deviation from this can then be considered as inhomogeneity.

The example with three stations below shows that you can see breaks more clearly in a difference time series (it only shows the noise reduction as no nonlinear trend was added). You can see a break in the pairs B-A and in C-A, thus station A likely has the break. This is confirmed by there being no break in the difference time series of C and B. With more pairs such an inference can be made with more confidence. For more graphical examples, see the post Homogenization for Dummies.

Figure 1. The temperature of all three stations. Station A has a break in 1940.
Figure 2. The difference time series of all three pairs of stations.

Monday, 3 June 2013

Reviews Paleofantasy? Maybe eating meat, nuts, fruit and vegetables is okay

Jason Collins has just written a review of Marlene Zuk’s book "Paleofantasy: What Evolution Really Tells Us about Sex, Diet, and How We Live". Having read several reviews of this book, this review sounds like the one I would have written, had I read the book. (I am not the only one; many reviews were written based upon previous articles by Zuk and not based on her book. Jason Collins did read the book.)
... Zuk parades a series of straw men rather than searching for the more sophisticated arguments of Paleo advocates. Many chapters begin with misspelled comments that Zuk found under blog posts. While Zuk shoots the fish in the barrel, the more interesting targets are not addressed.
I had almost chosen as title: debunking a book that promotes a diet full of processed "foods", grains and sugar and warns for a diet of meat, nuts, fruit and vegetables. Fortunately, that super straw man title was too long. This one, Maybe eating meat, nuts, fruit and vegetables is okay, is straw manly enough; it can be hard find a good concise title.

My paleofantasy

To me, paleo is not much more than a productive generator of hypothesis and a good story that helps to bundle several suggests for life-style changes.

Although you can say, that it would be very surprising that a diet humans were eating for a such long time, a time largely without chronic decease, would be unhealthy in this modern age. Not impossible, but you would expect very strong proof, much stronger as, for example, the epidemiological study promoted by T. Colin Campbell in his vegan bible: The China Study.

And the narrative is good enough to encourage people to try a range of different diets and life-style options to see on which one they feel best and not stick to the officially healthy one, if it is not working for them. Just play and experiment, that is what defines us as humans.

Review by Hunt Gather Love

You can go to Hunt Gather Love, for a more technical and intelligent review on Paleofantasy from someone who "wanted to like this book". Another good related post from the same blog: paleo fantasies: Debunking The Carnivore Ape Narrative, makes clear that paleo hypothesis does not prescribe a diet of only meat, nor a low-carb diet.

Sunday, 26 May 2013

Christians on the climate consensus

Dan Kahan thinks that John Cook and colleagues should shut up about the climate consensus; the consensus among climatologists that the Earth is warming and human action is the main cause. Kahan claims that research shows that talking about consensus is:
a style of advocacy that is more likely to intensify opposition ... then [to] ameliorate it
It sounds as if his main argument is that Cook efforts are counter productive because Cook is not an American Republican, which is hard to fix.

Katryn Hayhoe

As an example of how you communicate climate science the right way, Kahan mentions Katryn Hayhoe as an example. Hayhoe is an evangelical climate change researcher and stars in three beautifully made videos where Hayhoe talks about God and climate change.

Except that she also talks about her religion, I personally see no difference with any other message for the general public on climate change. She also openly speaks about the disinformation campaign by the climate ostriches.
The most frustrating thing about her position, she says, is the amount of disinformation which is targeted at her very own Christian community.
Maybe naively, but I was surprised that the Christian community is a special target. While I am not a Christian myself, my mother was a wise environmentally concious woman and a devout Christian. Also when in comes to organized religion, I remember mainly expressions of concern about climate change. Thus I thought that Christians are a positive, maybe even activist, force with respect to climate change.

Thus let's have look what the Christian Churches think about climate change.

Monday, 20 May 2013

On consensus and dissent in science - consensus signals credibility

Since Skeptical Science published the Pac Man of The Consensus Project, the benign word consensus has stirred a surprising amount of controversy. I had already started drafting this post before, as I had noticed that consensus is an abomination to the true climate ostrich. Consensus in this case means that almost all scientists agree that the global temperature is increasing and that human action is the main cause. That the climate ostriches do not like this fact, I can imagine, but acting as if consensus in itself is in bad thing in itself sounds weird to me. Who would be against the consensus that all men have to die?

Also the Greek hydrology professor Demetris Koutsoyiannis echoes this idea and seems to think that consensus is a bad thing (my emphasis):
I also fully agree with your statement. "This [disagreement] is what drives science forward." The latter is an important agreement, given a recent opposite trend, i.e. towards consensus building, which unfortunately has affected climate science (and not only).
So, what is the role of consensus in science? Is it good or bad is it helpful or destructive, should we care at all?

Credibility

In a recent post on the value of peer review for science and the press, I have argued that one should not dramatize the importance of peer review, but that it is a helpful filter to determine which ideas are likely worth studying. A paper which has passed peer review, has some a-priory credibility.

In my view, consensus is very similar, consensus lends an idea credibility. It does not say that an idea is true; if formulating carefully a scientist will never state that something is true, not even about the basics of statistical mechanics or evolution, which are nearly truisms and have been confirmed via many different lines of research.

Wednesday, 15 May 2013

Readership of all major "sceptic" blogs is going down

In my first post of this series I showed that the readership of WUWT and Climate Audit has gone down considerably according to social bookmarking site Alexa; see below. (It also showed that the number of comments at WUWT is down by 100 comments a day since beginning 2012.)


reach of WUWT according to Alexa

reach of Climate Audit according to Alexa

I looked a bit further on Alexa and this good news is not limited to these two. All the "sceptics" blogs I knew and had statistics are going down. Bishop Hill, Climate Depot, Global Warming, Judith Curry, Junk Science, Motls, and The Blackboard (Rank exploits) are all going down. Interestingly the curves look very different for every site and unfortunately they show some artificial spikes. Did I miss a well known blog?

Friday, 10 May 2013

Decline in the number of climate "sceptics", reactions and new evidence

My last post showing that the number of readers of Watts Up With That and Climate Audit are declining according to Alexa (social bookmarking) has provoked some interesting reactions. A little research suggests that the response post by Tom Nelson: Too funny: As global warming and Al Gore fall off the general public's radar, cherry-pickin' warmist David Appell argues that WUWT is "Going Gently Into That Good Night", could be a boomerang and another sign of the decline. More on that and two more indications that climate change ostriches are on their way back.

Public interest in climate change

An anonymous reader had the same idea as Tom Nelson, but did not write a mocking post, but politely asked:
"how do you know it is not a general diminution of interest in climate change?".
That is naturally possible and hard to check without access to the statistics of all climate related blogs and news pages. However, as you can see below, the number of readers of SkepticalScience and RealClimate seem to be stable according to Alexa. This suggests that the decline is not general, but specific to the "sceptic" community.

Sunday, 5 May 2013

The age of Climategate is almost over

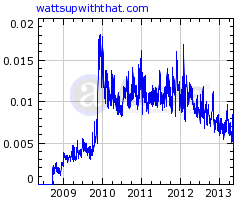
It seems as if the age of Climategate is over (soon). Below you can see the number of Alexa (social bookmarking) users that visited What Up With That? At the end of 2009 you see a jump upwards. That is where Anthony Watts made his claim to fame by violating the privacy of climate scientist Phil Jones of the Climate Research Unit (CRU) and some of his colleagues.

Criminals broke into the CRU backup servers and stole and published their email correspondence. What was Phil Jones' crime? The reason why manners and constitutional rights are not important? The reason to damage his professional network? He is a climate scientist!

According to Watts and co the emails showed deliberate deception. However, there have been several investigations into Climategate, none of which found evidence of fraud or scientific misconduct. It would thus be appropriate to rename the Climategate to Scepticgate. And it is a good sign that this post-normal age is (almost) over and the number of visitors to WUWT is going back to the level before Climategate.

Since the beginning of 2012, the number of readers of WUWT is in a steady decline. It is interesting coincidence that I started commenting once in a while since February 2012. Unfortunately for the narcissistic part of my personality: correlation is not causation.

The peak in mid 2012 is Anthony Watts first failed attempt in writing a scientific study.

According to WUWT Year in review (Wordpress statistics), WUWT was viewed about 31,000,000 times in 2011 and 36,000,000 times in 2012. However, a large part of the visitors of my blog are robots and that problem is worse here as for my little read German language blog. Alexa more likely only counts real visitors.