Pages

Monday, 28 July 2014

Is the US historical network temperature trend too strong?

Climate dissenters often claim that the observed temperature trend is not only due to global warming, but for a large part due to local effects: due to increases in urbanization around the stations or somehow because of bad micro-siting.

A few days ago I had a twitter discussion with Ronan Connolly. He and his father claim that 0.2°C per century of the temperature increase in the USA is due to urbanization and 0.1°C per century is due to micro-siting. That is quite a lot. Together it would be almost half of the temperature trend seen in the main global datasets.


One of the great things of America is that they have a climate reference network (USRCN). The observations are normally made by the meteorologists and contain non-climatic effects that are not relevant for the meteorologists, but they are to climatologists. Thus to track accurately what is happening to the climate, NOAA has set up a climate reference network that follows high climatological standards. The main thing for this post is that these stations are located in pristine locations, without any problems with urbanization and micro-siting.

We only have data from this network starting in 2005. That is only a decade of data, but if the problems with the normal data are as large as Connolly claims, I thought we might be able to see some differences between the reference network and the normal US historical Climate Network (USHCN). In the USHCN non-climatic effects have been removed as well as possible with the pairwise homogenization algorithm (PHA) of NOAA.

The figure of NOAA below (in Fahrenheit) shows that USHCN (normal) and USRCN (reference) track each other quite closely. If you look at the details, you can see that actually the USRCH is a little below USHCN in the beginning and a little above at the end. In other words, the temperatures of the reference network are warming faster than those of the normal network. The opposite of what the climate dissenters would expect.


Let's have a more detailed look at the difference between the two networks in the following graph. It shows that the warming in the reference network was 0.09°C stronger per decade. For comparison with the trend due to global warming, you could also say that it is 0.9°C stronger per century. That is just as much as the observed global warming trend.


That the trend in the normal data is an underestimate of the true warming is no surprise for me. The trend of the raw American data has a strong cooling bias. Removing of non-climatic effects (homogenization) increases the temperature trend since 1880 by 0.4°C. We also know that homogenization can make trend estimates more reliable, but cannot fully remove the bias. Thus it was likely that there was a remaining cooling bias.

The cooling bias could be due to a number of effects. An important cooling bias in the USA is the transition of conventional observations with a cotton region shelter to automatic weather stations (maximum-minimum temperature systems). This transition is almost completed and was more intense in the previous century. Other biases could be the relocation of city stations to airports. This mainly took place before and during the second world war. The increased in interest in climate change may have increased interest in urbanization and micro-siting, which may thus have improved over time due to relocations. (Does anyone know any articles on that? I only know one for Austria.) There is also a marked increase in irrigation of gardens and cropland the last century.

That the effect is this strong is something we should probably not take seriously (yet). We only have nine values and thus a large uncertainty. In addition, homogenization is less powerful near the edges of the data, you want to detect changes in the mean and should thus be able to compute a mean with sufficient accuracy. As a consequence, NOAA does not adjust the last 18 month of the data, while half of the trend is due to the last two values. Still an artificial warming of USHCN, as the climate dissenters claim, seems highly unlikely.

This cooling bias is an interesting finding. Even if we should not take the magnitude too seriously, it shows that we should study cooling biases in the climate observations with much more urgency. The past focus on detecting climate change has led to a focus on warming biases, especially urbanization. Now that that problem is cleared, we need to know the best estimate of the climatic changes and not just the minimum estimate.

Maybe even more importantly, it shows that we need climate reference networks in every country. Especially to study climatic changes in extreme weather in daily station data, data that is much harder to homogenize than the annual means. We are performing a unique experiment with our global climate system. Future scientists will never forgive us if we do not measure what is happening as accurately as we can.

[UPDATE. In case anyone wants to analyse the "dataset", here it is:
diff = [0.017 0.050 0.022 0.017 0.022 0.017 -0.006 -0.039 -0.033]; % Difference USHCN-USRCN in °C
year = 2005:2013;
]

See also

Howard J. Diamond, Thomas R. Karl, Michael A. Palecki, C. Bruce Baker, Jesse E. Bell, Ronald D. Leeper, David R. Easterling, Jay H. Lawrimore, Tilden P. Meyers, Michael R. Helfert, Grant Goodge, Peter W. Thorne, U.S. Climate Reference Network after One Decade of Operations: Status and Assessment, Bulletin of the American Meteorological Society, 2013, 94, 4, 485, doi: 10.1175/BAMS-D-12-00170.1.

Tuesday, 22 July 2014

Six sleep and jetlag tips

Bed time at the Hohenzollernbrücke Kölner Dom

Blogging has been light lately, I was at a workshop on statistics and homogenization in the USA. For me as old European this is another continent, 8 hours away. Thus I thought I'd share some jetlag tips, most of which are generally good sleeping tips as well. The timing is good: many people have trouble sleeping during the warm summer nights.

As far as I know, science does not really understand why we sleep. My guess would be: variability. Which is always my answer to stuff we do not understand. Most problems involving only the mean have been solved by now.

By doing the repairs and maintenance of your body at night, when there was not much else to do in the times before electrical light, you can allocate more energy to other stuff during the day and, for example, outrun someone who is repairing his cells all the time. Creating some variability in tasks between day and night thus seems to make evolutionary sense.

(The part I do not understand is why you have to lie down and close your eyes. Isn't is enough to simply rest? That seems to be so much less dangerous. But maybe the danger was not that large in bands where everyone has its own sleeping rhythm and someone is wake at most times.)

To differentiate between day and night, you need internal clocks to coordinate the action. Clocks that tell you to increase your cortisol in the hour before waking up, to get your body ready for action again. Clocks that tell you to reduce urine production during the night. Clocks that reduce the motility of your intestines while sleeping. Clocks that tell you to wind down and get ready for sleep in the evening. And so on.

These chemical clocks need to be synchronized, they do so mainly by light, but I have heard claims that also movement is signal for these clocks to keep track of the time. Without synchronization most people have an internal clock that runs one or more hours late and produces days that are longer than 24 hours. This natural period varies considerably. People who are night owls, most scientists for example, have longer internal days as early birds. I seem to be an extreme owl and can stay awake and concentrated all night. The rising sun is sometimes my last reminder that I really need to get to bed because otherwise my time becomes too much off with the rest of society.

1. Take your natural rhythm into account

Which brings me to tip 1. Or maybe experiment 1. For me as an owl, flying East is hard. It makes the day shorter and the days are already much too short for me anyway. In case of this last flight home, it made the day 8 hours shorter, not 24, but only 16 hours. Horror. Thus you have to go to bed well before you are tired and consequently cannot sleep.

My experiment was to stay awake during the flight. That made my day not 8 hours shorter, but 16 hours longer. Such a 40 hour day is probably too much for most, but given my natural long day, this seems to have worked perfectly for me. I hardly had any jetlag this time, almost like flying West, which also comes easy for me. I am curious what the experiences of others are. And can this trick be used by early birds flying West as well?

2. Light exposure

Light is vital for setting your internal clocks. Try and get as much sun as possible after your jetlag. Walk to work, take breaks outside, eat your meals outside, whatever is feasible. Often conferences are in darkened rooms, which mess up you clocks even without jetlag. Consider arriving early and spend your days before the conference outside.

Also on normal days, night owls should make sure that they get as much light exposure as possible and get outdoors early in the day to quickly tell your internal clock that it is day. It may help early birds to stay awake to seek the sun later in the day.

3. Artificial light

Artificial light, especially blue light, fools your internal clocks into thinking it is still day. If you do not become sleepy and have trouble getting to sleep, try to limit your exposure to artificial light in the evening. There are large differences in the color of the light between light bulb, select one that gives a nice warm glow and do not make the room too bright. The availability of artificial light is thought to have increased variability in sleeping times by making it easier for night owls to stay awake.

4. Blue glowing screens

Also monitors and smartphones give of a lot of blue light. I have f.lux installed on all my computers, it removes the blue light component from your monitor. I am not sure it helped me, but it cannot hurt in any way as long as the work you do is not color-sensitive. (If it sometimes it, you can easily turn it off.)

5. Pitch dark

Different Blindfolds for sleeping and resting
Make sure that your sleeping room is completely dark. This signals your clocks that it is night. Doing so improved the quality of my sleep a lot. They say this becomes more important as you age. Before putting blinders on your windows or hang up light blocking curtains, you can experiment and see if this is important for you by putting on a sleeping mask or simply lay a dark t-shirt over your eyes. (As an aside, also sleeping on a firm surface rather than a mattress improved the quality of my sleep I am curious whether other people have similar experiences.)

6. Sleep rhythm

The ideal nowadays is to sleep in one long period. This may be a quite recent invention to be able to use the evening productively using artificial light. Before people are thought to have slept a period after sunset, woke up for a few hours doing some stuff humans do and sleep another period. Even if this turns out not to be true, there is nothing wrong with sleeping in a few periods or with taking a nap. If you are awake, just get up, do something and try again later. I am writing this post in such a phase. Uncommon for me, probably due to the jetlag, I was tired at 8pm and slept two hours. When this post is finished, I will sleep the other 6 hours.

Related to this: try not to use an alarm clock. I realize this is difficult for most people due to social pressures. In this case you can set your alarm clock at a late time, so that you will often wake up before your alarm clock. Many people report waking up with gradually increasing light intensities is more pleasant, but also these devices are still an alarm clocks.

What do you think? Do you have any experience with this? Any more tips that may be useful?

Tuesday, 8 July 2014

Understanding adjustments to temperature data

by Zeke Hausfather

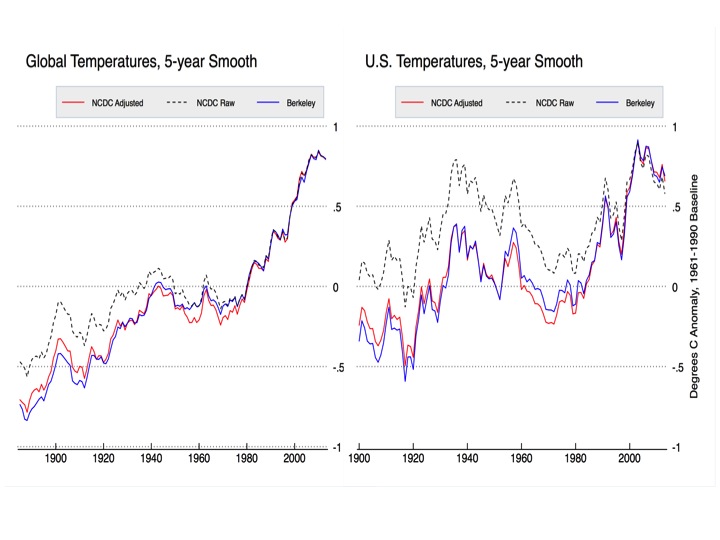
There has been much discussion of temperature adjustment of late in both climate blogs and in the media, but not much background on what specific adjustments are being made, why they are being made, and what effects they have. Adjustments have a big effect on temperature trends in the U.S., and a modest effect on global land trends. The large contribution of adjustments to century-scale U.S. temperature trends lends itself to an unfortunate narrative that “government bureaucrats are cooking the books”.

Slide1

Figure 1. Global (left) and CONUS (right) homogenized and raw data from NCDC and Berkeley Earth. Series are aligned relative to 1990-2013 means. NCDC data is from GHCN v3.2 and USHCN v2.5 respectively.

Having worked with many of the scientists in question, I can say with certainty that there is no grand conspiracy to artificially warm the earth; rather, scientists are doing their best to interpret large datasets with numerous biases such as station moves, instrument changes, time of observation changes, urban heat island biases, and other so-called inhomogenities that have occurred over the last 150 years. Their methods may not be perfect, and are certainly not immune from critical analysis, but that critical analysis should start out from a position of assuming good faith and with an understanding of what exactly has been done.

This will be the first post in a three-part series examining adjustments in temperature data, with a specific focus on the U.S. land temperatures. This post will provide an overview of the adjustments done and their relative effect on temperatures. ...


Read more at Climate Etc.


(ht Hotwhopper)