Before the last IPCC report the estimate for equilibrium climate sensitivity was between 2°C and 4.5°C with a best estimate of 3°C. I do not know of any explicit statement, but I have the feeling that the new studies with low estimates from energy budget models were the reason why the last IPCC report reduced the lower bound to 1.5°C. Since the reasons for the discrepancies were not understood the last IPCC report no longer gave a best estimate for equilibrium climate sensitivity.
The equilibrium climate sensitivity is defined as the equilibrium change in global mean near-surface air temperature after doubling the atmospheric concentration of carbon dioxide.
A Nature News and Views by Kyle Armour (2016) showed this week that three assumptions made in the simple energy budget models lead to strong biases.
1. This week Mark Richardson and colleagues (2016) showed that the temperature change is underestimated because we have few measurements in regions where the change is large, especially the Arctic. This masking problem creates a bias of 15%.
Furthermore, over the ocean, empirical estimates do not use the air temperature, but use the sea surface temperature instead; the water temperature is a much smoother field and can thus be estimated using many fewer samples, which is good because observations over the oceans are sparse. Above sea ice the air temperature is used. Thus this also means that the decrease in the ice cover need to be taken into account. The temperature trend of the air temperature over the ocean is also higher than the trend of the sea surface temperature. Both effects make the "observed" trend 9% smaller.*
2. Climate change is mainly due to increases in carbon dioxide concentrations, but also warming due to increases in methane concentrations, cooling due to increases in aerosols (small airborne particles) and changing due to land use changes. Half a year ago Kate Marvel and colleagues showed that these forcings do not have the same global effect as carbon dioxide and that, as a consequence, the energy balance models are biased low. Marvel and colleagues estimate that this makes the estimates of energy balance models 30% too low.
3. Kyle Armour and colleagues (2013) previous work showed that in the early warming phase climate sensitivity appears smaller than the true value you would get if you would wait till the system has returned to equilibrium. This leads to an underestimate of 25%.
Taking all three biases into account the best estimate from the energy balance models from around 2°C estimate becomes 4.6°C**; see Figure 1b of Armour (2016) reproduced below.

Climate sensitivity estimated from observations1 (black), and its revision following Richardson et al. (blue) then following Marvel et al. (green), and in red the revision for the time dependence (Armour). The grey histogram shows climate model values.
The equilibrium climate sensitivity from global climate models is about 3.5°C***, which is close to the best estimate from all lines of evidence of about 3°C. The "empirical" estimate of 4.6°C is now thus clearly larger than the ones of the global climate models.
Is that a reason to freak out? Have we severely underestimated the severity of the problem?
Probably not, there are many different lines of evidence that support an equilibrium climate sensitivity around 3, with a likely range from around 2 to about 4.5. That the simple energy balance models might now suggest a best estimate of around 4.6°C does not really influence this overall assessment. It is just one line of evidence.
That the energy balance climate sensitivity is minimally above the upper bound does not change this. These energy balance models have not been studied much and the biases are so large that the correction need to very accurate, while they are currently mostly based on single studies. It is quite likely that this value will still change the coming years. If this value still holds after a dozen more studies you may want to consider freaking out a little. How uncertain this bias corrected climate sensitivity is is illustrated by its wide distribution in the above graph with a 95% uncertainty range of 2.5-12.8°C.
[UPDATE. Gavin Schmidt mentions on twitter that it should also be studied whether these three factors are fully independent. While they seem to relate to different aspects there could be a link because spatial patterns and forcing efficacy are strongly related. Thus it would be valuable to make a study that considers all three biases in combination.]
The promotion of the cherry picked climate sensitivity of 2°C, or lower, was disingenuous. A similar promotion of a value of 4.6°C would be no better. (Someone promoting a climate sensitivity of 12.8°C deserves a place in statistical Purgatory.)
There are many other lines of evidence for an equilibrium climate sensitivity around 3, from basic physics, to global climate models, various climatic changes in the deep past and the climate response to volcanoes. Before accepting values far away from 3 we would need to understand the physics of the feedbacks that produce such deviations.

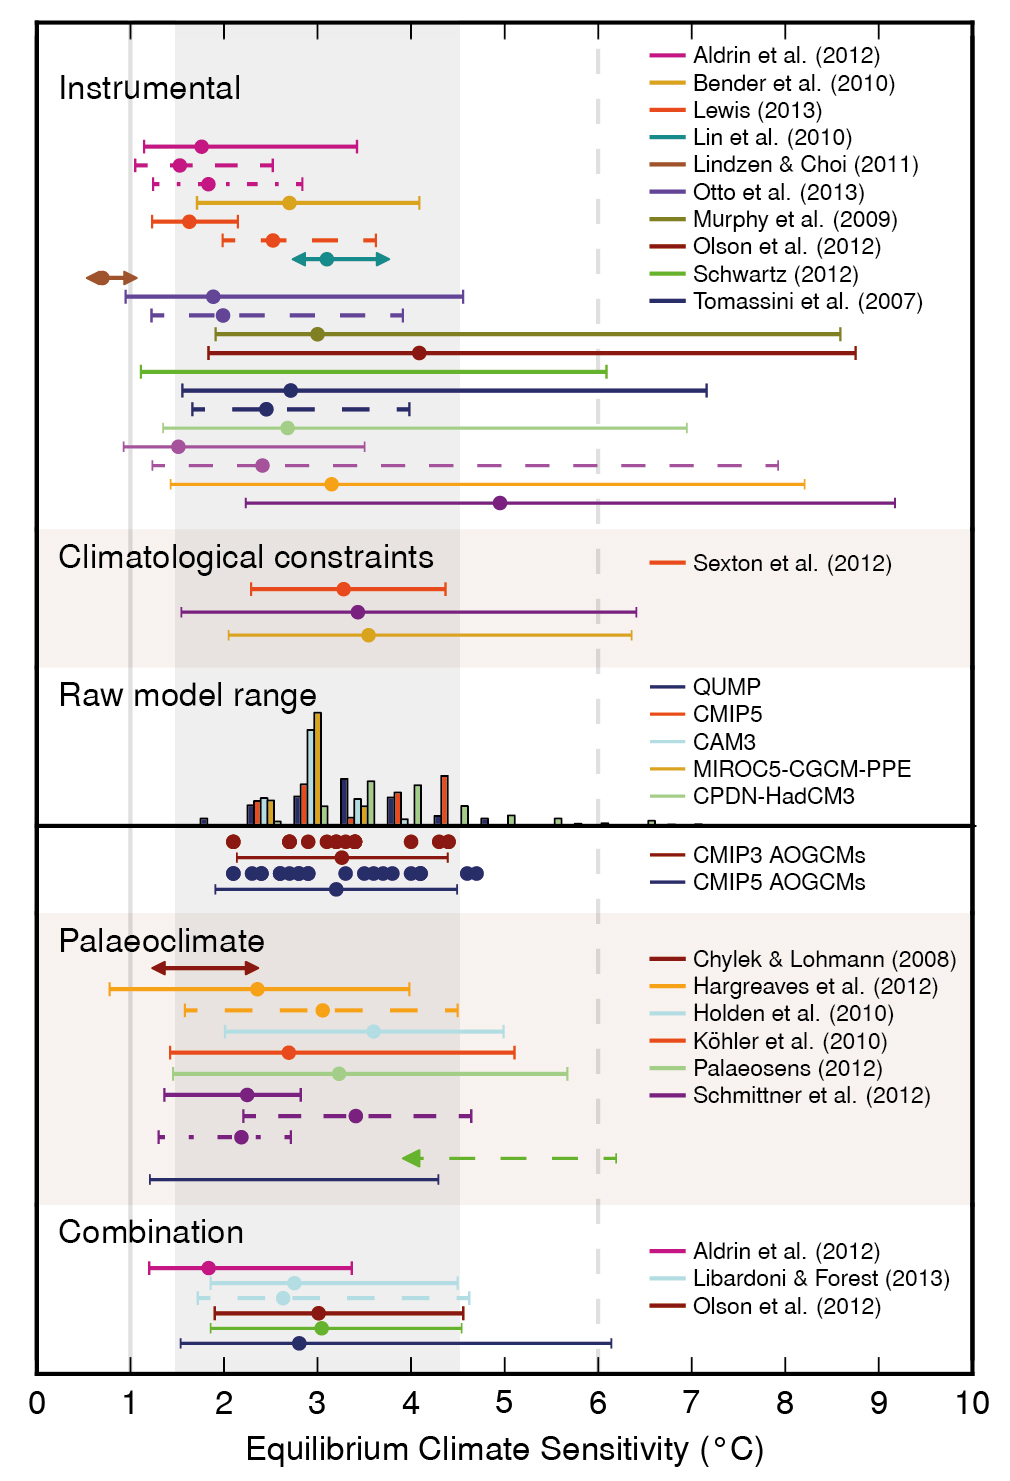
Figure 1 Ranges and best estimates of ECS based on different lines of evidence. Bars show 5-95% uncertainty ranges with the best estimates marked by dots. Dashed lines give alternative estimates within one study. The grey shaded range marks the likely 1.5°C to 4.5°C range as reported in AR5, and the grey solid line the extremely unlikely less than 1°C, the grey dashed line the very unlikely greater than 6°C. Figure taken from figure 1 of Box 12.2 in the IPCC 5th assessment report (AR5). Unlabeled ranges refer to studies cited in AR4. The figure in the review article by Knutti and Hegerl (2008) presented by Skeptical Science is also a very insightful overview.
The likely range of possible climate sensitivity values has been between 1.5°C and 4.5°C since the 1979. That does not sound like much progress. However, we now have many more lines of evidence and those lines have been much better vetted. Thus we can be more sure nowadays that this range is about right. A large part of the uncertainty comes from cloud and vegetation feedbacks. Having worked on clouds myself, I know that these are very difficult problems. Thus I am not hopeful that the uncertainty range will strongly decrease the coming decade or maybe even decades.
We will have to make decisions in the face of this uncertainty. Like any decision in a complex world.
Tweet
Notes
* The temperature trend of the air temperature over the ocean is 9% higher than the trend of the sea surface temperature in the CMIP5 models. For most models the top layer is 10 m deep. For those models with a higher vertical resolution the trend is only 8% higher. The difference is small and not statistically significant, but the effective resolution of numerical models is normally larger than the nominal resolution, thus I would not be surprised if studies with dedicated high resolution models may lead to estimates that are a few percent points lower.** If we simply combine all these biases: 1.24 (Richardson) * 1.30 (Marvel) * 1.25 (Armour) we get that the simple energy balance models are biased by as much as a factor 2. Taking this into account could suggest increasing the best estimate from the energy balance models from around 2oC to around 4oC. Because of the uncertainty around the estimates and the thick tails, the estimate becomes 4.6°C. See Figure 1b of Armour (2016).
*** The ensemble of global climate models of the CMIP5 project have an average climate sensitivity of 3.5°C with a 95% uncertainty range of 2.0-5.6°C (Geoffroy, et al. 2013).
**** Many thanks to Kyle Armour and And Then There’s Physics for many helpful hints and comments. Any errors are naturally mine.
Related reading
Nature Geoscience: Impact of decadal cloud variations on the Earth’s energy budget. A physical explanation of why climate sensitivities estimated from recently observed trends are probably biased low.An oldie from Science in 2004: Three Degrees of Consensus explains the various ways to estimate climate sensitivity and why it may have been more luck than wisdom that the first estimate of the range of the climate sensitivity still holds.
Skeptical Science: How sensitive is our climate?
Climate dialogue: Climate Sensitivity and Transient Climate Response
Fans of Judith Curry: the uncertainty monster is not your friend
Tough, but interesting for scientists: Andrew Dessler talk at Ringberg15 on why the equilibrium climate sensitivity exceeds 2°C.
References
Armour, Kyle C., 2016: Projection and prediction: Climate sensitivity on the rise. Nature Climate Change, News and Views, doi: 10.1038/nclimate3079.Armour, Kyle C., Cecilia M. Bitz and Gerard H. Roe, 2013: Time-Varying Climate Sensitivity from Regional Feedbacks. Journal of Climate, doi: 10.1175/JCLI-D-12-00544.1
Geoffroy, O., D. Saint-Martin, G. Bellon, A. Voldoire, D.J.L. Olivié and S. Tytéca, 2013: Transient Climate Response in a Two-Layer Energy-Balance Model. Part II: Representation of the Efficacy of Deep-Ocean Heat Uptake and Validation for CMIP5 AOGCMs. Journal of Climate, 26, pp. 1859- 1876, doi: 10.1175/JCLI-D-12-00196.1.
Marvel, K., G.A. Schmidt, R.L. Miller and L.S. Nazarenko, 2015: Implications for climate sensitivity from the response to individual forcings, Nature Climate Change, 6, pp. 386-389. 10.1038/nclimate2888.
Richardson, Mark, Kevin Cowtan, Ed Hawkins and Martin B. Stolpe, 2016: Reconciled climate response estimates from climate models and the energy budget of Earth. Nature Climate Change, doi: 10.1038/nclimate3066. If you cannot read this article at Nature, you can go there via The Guardian, which has a special link that allows everyone to read (not download) the article. See also the News and Views on this article by Kyle Armour.
Otto, A., F.E.L. Otto, O. Boucher, J. Church, G. Hegerl, P.M. Forster, N.P. Gillett, J. Gregory, G.C. Johnson, R. Knutti, N. Lewis, U. Lohmann, J. Marotzke, G. Myhre, D. Shindell, B. Stevens, and M.R. Allen, 2013: Energy budget constraints on climate response", Nature Geoscience, 6, pp. 415-416. 10.1038/ngeo1836.