Sunday 28 December 2014

Blog network analysis: WUWT & Co. isolated from science

UPDATE: In retrospect I should have chosen a more careful title.


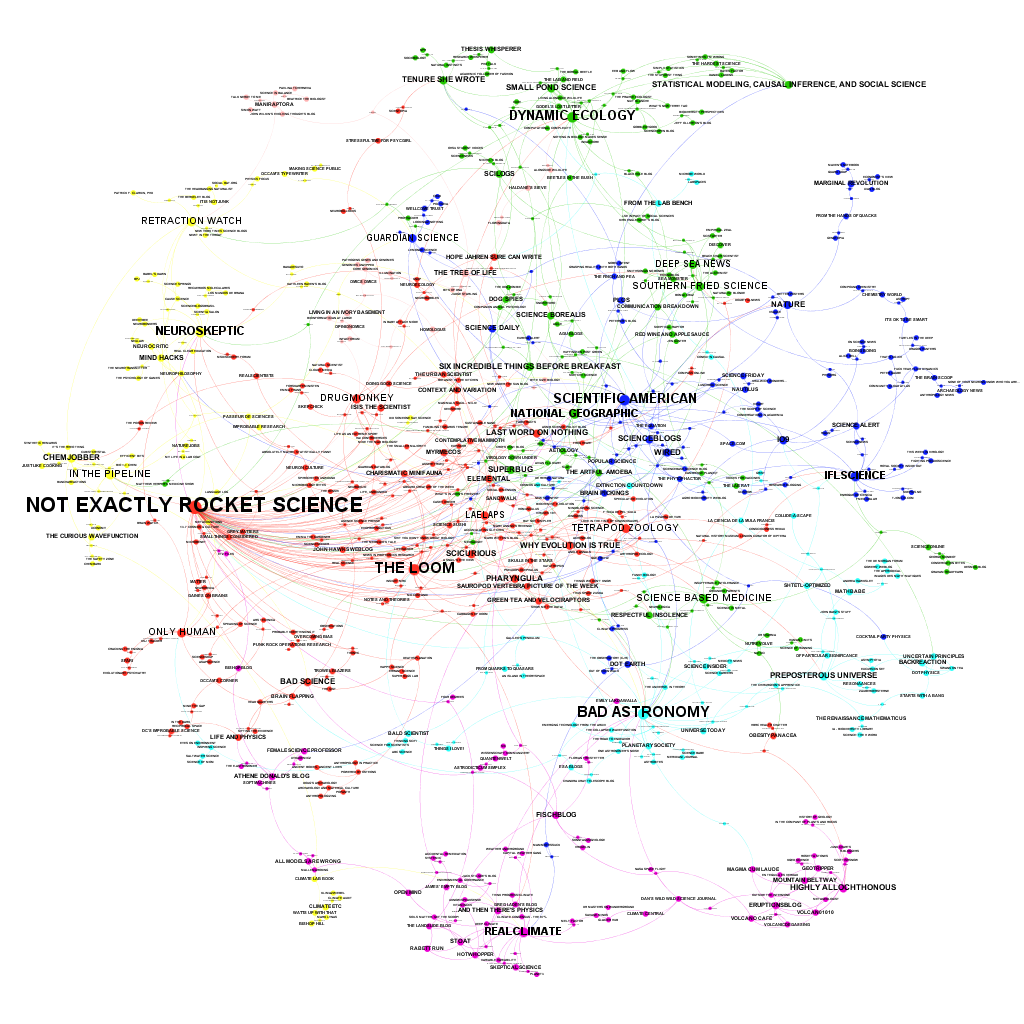
Paige Brown Jarreau performed a survey among science bloggers. A first result is the fascinating network analysis of science blogs shown above. She also published a PDF where you can zoom in to look at the details. The survey asked every blogger to list three other regularly read science blogs. In the figure above the blogs are the dots and every mention is a link between the dots. The more incoming links, the bigger the dot and name. The links do not show in which direction the link runs. The smallest print is for blogs that participated, but have no incoming links.

Clearly dominating is the blog Not Exactly Rocket Science by Ed Young. Also influential is Bad Astronomy by Phil Plait, who also blogs about climate and the "climate debate". Except for these two outliers, the network is surprisingly egalitarian.

There is likely a sampling bias, but the small number of non-english blogs is striking.

For us the climatic part of the blog universe is naturally most interesting.


Here RealClimate clearly dominates. Even if they are not that active anymore and are calling for a new generation of climate scientists to help them continue high-quality climate science blogging.

One should be very careful to interpret the details. My little blog is only more visible than the blog of the more important International Surface Temperature Initiative because I have one incoming link. Such details can thus quickly change when more bloggers had participated or more than 3 blogs could have been mentioned.

Emphasized by the automatic coloring scheme is the splendid yellow isolation of WUWT & Co. If there would be no link between WUWT and the Climate Lab Book, they would have no link to science whatsoever. This network analysis could be used to determine who is eligible for a bloggie in the category science.

[UPDATE 3: The WUWT cluster looks large, it has 8 blogs and many links between them, but this feature is less robust than you would thus think. It is only based on the responses of 3 bloggers. Had I thought of that before, I would have chosen a more careful title.]

Here it should probably be mentioned that a link is not necessarily a recommendation. I know of some US climate scientists that keep an eye on WUWT to know of the latest nonsense story before the journalists start calling. You can be sure that they do not read WUWT to learn about the climate system. The isolation was to be expected given the quality standards at WUWT, which do not fit to science.

On the other hand, the purple climate and geo sciences cluster is clearly well embedded in the scientific community. The blogs Climate Etc. and Klimazwiebel often talk about building bridges to the mitigation sceptics. Maybe they should put a bit more emphasis on building bridges to the scientific community. (And I sometimes wonder why they do not want to build bridges to alarmist activists as well.)

[UPDATE 1: William M. Connolley reports on this post at Stoat and unfortunately emphasizes the presence of Mark Lynas and the Klimazwiebel in the yellow cluster. Both depends on only one link, on only one blogger mentioning them. Such details should not be taken seriously. The yellow cluster having little interaction with science blogs would likely remain if a bigger sample were available, but details about single little-mentioned blogs could completely change.]

More activist blogs, such as Georg Monbiot and Desmog Blog are not in the climate cluster, but can be found on the middle right as a green cluster.

[UPDATE 2: There are now several blog posts on this topic.

Stoat (William M. Connolley) and Climate Etc. (Judith Curry) summarize this post. The comment section at CE is, again, very ugly, full of personal attacks, which is the response of last resort if you do not have any arguments. Fitting to the isolation of the WUWT & Co cluster is that the Stoat post gives me more visitors than the post at Climate Etc. While for a Climate Etc. reader it would make more sense to expect that my post is misrepresented and thus to click on the link to check what was really written. And just like WUWT, Climate Etc. is proud of the large amount of comments and clicks; Judith Curry in 2010: "If what I said was utter nonsense, why is anyone here talking about it, I have 440 comments in 24 hours." If CE is really so big, it certainly has more comments, you would expect more, not less, readers coming from there.

Lucia at The Blackboard reports about the Climate Etc. post with the funny title: HotWhopper’s Sou Doesn’t read WUWT!

A smart observation. Lucia is highly intelligent and a fierce debater. The climate "debate" would be more interesting if she would run WUWT. Unfortunately, she seems to see the climate "debate" as a sport. If she were more interested in improved understanding, I would read her blog often.

While it is a smart observation, the simple reason for the perceive discrepancy may be:


And indeed, Sou from HotWhopper writes (Hat tip Lucia in her comments):
The blog I probably visit most frequently I didn't list - because I don't rate it as a science blog, although I see that it appears on your map.
I mentioned:

And Then There's Physics: A great place for intelligent conversation on climate and the climate debate.

HotWhopper: A good place to keep up to date with what happens at WUWT without having to read the misinformation. Sometimes you do not remember where you got some information from, you might think it was a reliable source, whereas it was WUWT. I already embarrassed myself among colleagues by repeating something I had learned at WUWT and could not imagine being wrong, being so basic, but it was. Best to limit your exposure, to keep your brain healthy.

Real Climate: If there is a new RealClimate post that is likely to be a good investment of my precious life time and I read a large part of them to keep up to date with the state of the art in fields where I do not work on myself.

Lucia also wondered why I did not mention WUWT. I do not know anymore. Maybe because the question was about science blogs and WUWT is a political blog. The reaction of WUWT to a new piece of research can be predicted extremely well by considering whether it makes the political case for mitigation stronger or weaker. On a science blog, the reaction would depend on the quality of the research and whether the conclusions are justified by the evidence presented.

Maybe I also just did not mention WUWT because reading it is not a high priority. But I have never denied reading WUWT occasionally. When I read it, more out of interest as blogger. It is the voice of mainstream mitigation skepticism.

It is probably not a good idea to interpret single links and sizes of blogs. You should probably not even interpret the size of the clusters due inherent problems with sampling and because blogs in the cluster of WUWT & Co might not have seen themselves as the target group.

It is still interesting that the only link between the WUWT & Co. cluster to the rest is Ed Hawkins stating to read WUWT. None of the sampled blogs in the yellow cluster have reported themselves to read blogs outside of their cluster. The "isolation" is, in this respect, self-selected. In this regard, it is somewhat strong that mitigation skeptics complain about me showing this network.

If the sample were bigger, some links may have appeared. And there might be weaker links; had the question asked for a larger list of blogs, these links may have appeared, but the cluster would likely have stayed quite self-referential. I would expect that that part of the network analysis is robust and that is why I emphasized that part.

The survey was about what motives science bloggers. This network is interesting, but "just" a side result that should not be over-interpreted.]


Related reading

A Network of Blogs, Read by Science Bloggers. Here Paige Brown Jarreau (The Lab Bench) explains more details of the network analysis and shows a plot with all the blogs in the purple climate/geo science cluster.

The figures can be found at Figshare.

You can play with this data via an interactive Gephi graphic here: bit.ly/MySciBlogREAD, which also gives you links to the blogs to find new interesting ones.

Stoat: Tee hee

Readership of all major "sceptic" blogs is going down. (WUWT has already removed all independent counters.)

The BBC will continue fake debates on climate science.

Interesting what the interesting Judith Curry finds interesting.

Thursday 11 December 2014

Meetings for fans of homogenisation

There are a number of scientific meetings coming up for people interested in the homogenisation of climate station data.

CLIMATE-ES 2015

The International Symposium CLIMATE-ES 2015 (Progress on climate change detection and projections over Spain since the findings of the IPCC AR5 Report.) will be held in Tortosa, Tarragona, Spain, on 11-13 March 2015 and is organised by Manola Brunet et al.

Deadline for abstract submission and registration is in four days: 15 December 2014.

There is a session on Climatic observations and instrumental reconstructions: the development of high-quality climate time-series, gridded products and data assimilation techniques. Chaired by José Antonio Guijarro.

EGU2015

Three sessions at the general assembly of the European Geophysical Union (EGU) are interesting for us.

Climate Data Homogenization and Climate Trend and Variability Assessment by Xiaolan Wang et al.
... This session calls for contributions that are related to bias correction and homogenization of climate data, including bias correction and validation of various climate data from satellite observations and from GCM and RCM simulations, as well as quality control/assurance of observations of various variables in the Earth system. It also calls for contributions that use high quality, homogeneous climate data to assess climate trends and variability and to analyze climate extremes, including the use of bias-corrected GCM or RCM simulations in statistical downscaling. This session will include studies that inter-compare different techniques and/or propose new techniques/algorithms for bias-correction and homogenization of climate data, for assessing climate trends and variability and analysis of climate extremes (including all aspects of time series analysis), as well as studies that explore the applicability of techniques/algorithms to data of different temporal resolutions (annual, monthly, daily¦) and of different climate elements (temperature, precipitation, pressure, wind, etc) from different observing network characteristics/densities, including various satellite observing systems.

Bridging the gap between observations, reconstructions and simulations for the early instrumental period by Oliver Bothe et. al.
The early instrumental period, covering the late 18th century and the 19th century, was characterized by prominent external climate forcing perturbations, including but not limited to, the Dalton minimum of solar activity and strong volcanic eruptions (e.g., 1783/84 Laki, 1809 eruption at unknown location, 1815 Tambora, 1835 Cosigüina, 1883 Krakatoa). Climate conditions during this period are illustrated by many environmental archives of climate variability as well as by documentary sources and sparse instrumental observations available from various regions. The peculiar characteristics of this period also stimulated research based on numerical climate models. Beyond their direct impact, the external perturbations likely left longer term imprints on the climate system which might be unrepresented in the initial conditions of the historical simulations (1850 - today), thus affecting their reliability. ...

We invite submissions addressing climate variability of the early instrumental period, especially on works combining or contrasting different sources of information to highlight or overcome differences in our estimates about the climate of this period. Contributions aiming at exploring the role of the external forcing in climate variations during the period of interest are specially acknowledged. This includes new estimates about climate variability and forcing in this period. Furthermore, we welcome more general submissions about the long term imprints of episodes with strong natural forcing comparable to that in the early instrumental period.

Taking the temperature of the Earth: Temperature Variability and Change across all Domains of Earth's Surface by Stephan Matthiesen et al.
The overarching motivation for this session is the need for better understanding of in-situ measurements and satellite observations to quantify surface temperature (ST). The term "surface temperature" encompasses several distinct temperatures that differently characterize even a single place and time on Earth’s surface, as well as encompassing different domains of Earth’s surface (surface air, sea, land, lakes and ice). Different surface temperatures play inter-connected yet distinct roles in the Earth’s surface system, and are observed with different complementary techniques.

There is a clear need and appetite to improve the interaction of scientists across the in-situ/satellite 'divide' and across all domains of Earth's surface. This will accelerate progress in improving the quality of individual observations and the mutual exploitation of different observing systems over a range of applications. ...

The deadline for receipt of abstracts is 7 January 2015, and abstracts can be submitted through the session website.

10th EUMETNET Data Management Workshop

Just a pre-announcement, the next Data Management Workshop will be in St. Gallen, Switzerland on 28th-30th October 2015. Save the date in your agenda. Further announcements will follow later by Ingeborg Auer.

IMSC2016

Even further into the future, is the 13th International Meeting on Statistical Climatology in 2016 (IMSC2016), Vancouver, Canada. I guess the date itself is not fixed yet. Previous IMSC's were very interesting. The still empty page to bookmark.

More

Did I miss any upcoming meetings or other news? Please add them in the comments.

Tuesday 2 December 2014

The quality assurance system of WUWT


Monday 24 November 2014

Casual consensus and a lot of science

Have not been blogging much lately and the number of readers is suffering. So I need another post on the Climate Consensus; always a runner. At the Guardian, there is a discussion going on between 3 interesting people. John Cook, the benevolent dictator of Skeptical Science, Peter Thorne, the benevolent dictator of the International Surface Temperature Initiative (ISTI) and the benevolent dictator of And Then There's Physics (ATTP).

What I took from the discussion is that maybe we should not focus too much on communicating the consensus, still communicate it, but casually. That may actually make the consensus point more clearly.

If you do so casually, you produce less an impression that this could be a topic of debate, you thus create less false balance. If you mention the consensus casually, but focus on interesting points of scientific disagreement you also do not give the impression that the consensus means that everything is understood in sufficient detail.

AndThenTheresPhysics paints the dilemma:
"My understanding of the situation is something like this, though. A reasonably vocal group of people argue that there is a great deal of disagreement about climate science and that there is no consensus. Some other people then do a study to show that there is indeed a consensus, at least with regards to the basics. The first group of people then do their utmost to attack that result. Consequently another group of people do another study to show, once again, that there is a consensus. That too is then attacked so as to undermine that there is indeed a consensus. Then another study takes place, until we get to the point that even scientists are starting to question the whole consensus messaging because they perceive it as an attempt to communicate climate science through consensus messaging only (which I don't think is the intent, even if it might seem that way). That scientists are now criticising this then gives those who would rather there was no consensus (or that people thought there was no consensus) more ammunition to attack the various consensus projects."
Peter Thorne replies:
"But how do you break catch-22 here? Its not clear that continuing round the circle achieves anything other than getting dizzy. There are many interesting scientists on blogs and twitter (yourself and skepticalscience included) communicating in varied ways with nuanced messaging that perhaps gives a better sense of the science and the process than repeated articles on a consensus at the Guardian ever could."
"My point would be that while it is important to communicate the consensus it is at the same time a significant mistake in my personal view to obsess upon it or make it even the central strand of any discussion upon the issue."
Clearly we should avoid given the wrong impression that there is no consensus on the basics, but maybe just a half sentence with a link is enough on the internet and the rest of the message can focus on science. In the mass media, which is what Cook is thinking of, a simple message focussed on the existence of a consensus on climate change among climate scientists may well be effective. I am no expert, but Cook's arguments sound convincing.

Even if one accepts that consensus messaging is most effective to convince the population that there is a problem, that still does not mean that scientists should do this. Scientists have their own aims, skills and interests.

Peter Thorne:
Carbon dioxide and gases active in the IR spectrum we have known for over a Century will act to warm the atmosphere. On that you will find as close to consensus amongst qualified experts as in any field.

But that understanding is far from the end of the story and as you get to more and more nuanced questions there is no longer the degree of unanimity or consensus. If we knew everything there is to know then you wouldn't see several thousand papers a year appear in the peer reviewed literature on the subject providing new insights and building the knowledge base. Nor would you see repeated assessment activities such as IPCC. The issue with saying there is consensus repeatedly is that people then think, mistakenly, that all aspects of the science are settled. This is very far from the case.
As scientists we are naturally also very aware of the problems that are not solved. That is what we work on every day. That is the fascinating part. Just because the main lines are solid does not mean that we should no longer expect important changes in our understanding of the climate system and that all we need are applied studies on the impacts of climate change.

It seems to me somewhat premature to invest much manpower into studying how cauliflower, leek or wine with grow within some small region of Germany, France or Luxembourg. Not only because that needs predictions at a very local scale, which are much more difficult than large-scale predictions, but also because there is still important work to do the fundamentals of climate science. I would personally mention the influence of non-climatic changes on trends in extreme weather and I would love to see a global station network making climate-quality measurements, designed to avoid introducing non-climatic changes.

Not that I would argue that we should not do any impact studies. Doing so gives a first view of where the main societal problems may lie, it helps us see where the difficulties of impact studies are and to develop the tools that are needed to make reliable impact studies and estimate the corresponding uncertainties. However, maybe we do not need to study every vegetable for every province at his stage.

The International Surface Temperature is building an open global temperature dataset with good provenance relying on volunteers and some support by NOAA. For the first time on a global scale the ISTI will validate the algorithms to remove non-climatic temperature changes. Generating the validation dataset is supported by the MetOffice, but mainly performed by volunteers. My own smaller-scale validation study was a volunteer project, with some travel funding by COST. Peter is co-chair of GRUAN, a network of climate-quality radiosondes. A rather sparse network. And governments around the world are pruning the station network, regularly destroying some of the longest series we have. I am surely bias, but I would put my priorities in the data the science is founded on and not with cauliflower.

Yes, it is warming, but how much, where and when. If that changes due to our better understanding, we can redo all the studies for every vegetable and province. And that is just temperature. Many more aspects of the climate are changing. And those are just examples from my field. Other climate scientists could likely make a similar list of important questions that still need to be resolved. Especially, when it comes to adaptation local skill is important and hard to get. Investing in basic science may well save a lot of money for unnecessary adaptation measures.

Perhaps Peter Thorne said it better than I have:
"If we want to make truly informed and effective adaptation and mitigation decisions it is incredibly dangerous to contend that there is a consensus on anything more than the most general abstract aspects such as that Carbon Dioxide emissions are causing warming."

Citizen and scientist

When a mitigation sceptics doubt something basic, I find it natural for a normal citizen to answer, well there is a clear consensus on this topic, that is enough for me to hold this view, convince the scientists first before bothering me as a non-expert. That is just a shorthand for: I do not want to discuss this with you, I expect this to be pure nonsense and we are not the right persons to discuss this.

I would prefer it if a scientist (in the right field) would answer by providing the evidence. This is our role in society, even if it is not the most effective strategy to convince the population there is a problem.

The answer is mainly to make clear to the casual reader that there is an answer; one should have no illusions that this will lead to a productive conversation with the mitigation sceptic. If the answer is too good, the mitigation sceptic will change the topic and try the same loop somewhere else.

Even as scientist you do not have to jump all hoops. If someone claims CO2 is not a greenhouse gas, or that the temperature is decreasing or we will soon enter an ice age, there is nothing wrong with asking such fools to first convince their political allies Anthony Watts, Jo Nova or Roy Spencer, who officially reject these claims.

Depending on your role, you communicate differently. Thus maybe the Guardian debate was partially about how people see as their role.

As a citizen I feel that the arguments of John Cook make a lot of sense and I guess that it is necessary and effective to communicate to the publication that there is a consensus within climate science about the basics and that we are performing a dangerous experiment with the climate system our livelihoods depends up on.

In my role as scientist further aspects become important and one should make sure that the consensus message does not give the wrong impression that we already know everything sufficiently accurately and that all we need are impact studies for cauliflower.


Related reading

Why we need to talk about the scientific consensus on climate change. The Guardian article that inspired this post.

Five reasons scientists do not like the consensus on climate change. My first try to explain why scientists may not like communicating consensus and why these arguments do not hold water.

"Blinded by Science: How 'Balanced' Coverage Lets the Scientific Fringe Hijack Reality". A repost of an oldie from 2004 that is still current by Chris Mooney in Columbia Journalism Review.

The BBC will continue fake debates on climate science. "When a new member of our solar system was discovered, there was no debate with an astrologer claiming there was no empirical evidence, because you could not see VP113 with the naked eye."

The value of peer review for science and the press For science peer review is a filter. For the press an anchor.

On consensus and dissent in science - consensus signals credibility You have to pick your fights. On topics where there is dissent there is clearly work to do. Where there is a consensus finding a problem is hard, but thus also most rewarding.

The Tea Party consensus on man-made global warming. The people that call the climate consensus based on scientific evidence "group think", have a very strong consensus themselves, without much scientific evidence. Group think?

Wednesday 5 November 2014

Participate in the best validation study for daily homogenization algorithms

Rachel Warren is working on the validation of homogenization methods that remove non-climatic changes from the distribution of daily temperature data. Such methods are used to make trend estimates for changes in weather extremes and weather variability more accurate.

To study this, she has just released a numerical validation dataset. Everyone is invited to apply their homogenization method to this dataset. It looks to be the most realistic validation dataset produced up to now. Thus it promises to become an important paper for the homogenization community.

Rachel wrote about her study in a post at the blog of the benchmarking group of the International Surface Temperature Initiative. I hope it is okay that I republish it here below.

She is not the Rachel Warren of the Hip-Hop Dance Workout, that would be too much healthy fun for scientists, but Rachel Warren, the statistician from the University of Exeter. Hopefully the healthy smile on her photo makes up for the fun. And the interesting results of the study. VV


Release of a daily benchmark dataset - version 1
by Rachel Warren

Kate Willett's blog post from 6th October gives a detailed over-view of the benchmarking process that forms part of the ISTI's aims. It is hoped that in the long term these benchmarks will not only be produced at the monthly level, but also for daily data.

This post announces the release of a smaller daily benchmark dataset focusing on four regions in North America. These regions can be seen in Figure 1.


Figure 1 Station locations of the four benchmark regions. Blue stations are in all worlds. Red stations only appear in worlds 2 and 3.

These benchmarks have similar aims to the global benchmarks that are currently being produced by the ISTI working group, namely to:
  1. Assess the performance of current homogenisation algorithms and provide feedback to allow for their improvement
  2. Assess how realistic the created benchmarks are, to allow for improvements in future iterations
  3. Quantify the uncertainty that is present in data due to inhomogeneities both before and after homogenisation algorithms have been run on them

A perfect algorithm would return the inhomogeneous data to their clean form – correctly identifying the size and location of the inhomogeneities and adjusting the series accordingly. The inhomogeneities that have been added will not be made known to the testers until the completion of the assessment cycle – mid 2015. This is to ensure that the study is as fair as possible with no testers having prior knowledge of the added inhomogeneities.

The data are formed into three worlds, each consisting of the four regions shown in Figure 1. World 1 is the smallest and contains only those stations shown in blue in Figure 1, Worlds 2 and 3 are the same size as each other and contain all the stations shown.

Homogenisers are requested to prioritise running their algorithms on a single region across worlds instead of on all regions in a single world. This will hopefully maximise the usefulness of this study in assessing the strengths and weaknesses of the process. The order of prioritisation for the regions is Wyoming, South East, North East and finally the South West.

This study will be more effective the more participants it has and if you are interested in participating please contact Rachel Warren (rw307 AT exeter.ac.uk). The results will form part of a PhD thesis and therefore it is requested that they are returned no later than Friday 12th December 2014. However, interested parties who are unable to meet this deadline are also encouraged to contact Rachel.

There will be a further smaller release in the next week that is just focussed on Wyoming and will explore climate characteristics of data instead of just focusing on inhomogeneity characteristics.

Wednesday 15 October 2014

Scientific meetings. The freedom to tweet and the freedom not to be tweeted


Some tweets from a meeting on Arctic sea ice reduction organised by the Royal Society recently caused a stir, when the speaker cried "defamation" and wrote letters to the employers of the tweeters. Stoat and Paul Matthews have the story.

The speaker's reaction was much too strongly, in my opinion, most tweets were professional and respectful critique should be allowed. I have only seen one tweet, that should not have been written ("now back to science").

I do understand that the speaker feels like people are talking behind his back. He is not on twitter and even if he were: you cannot speak and tweet simultaneously. Yes, people do the same on the conference floors and in bars, but then you at least do not notice it. For balance it should be noted that there was also plenty of critique given after the talk; that people were not convinced was thus not behind his back.

Related to this, a blog post is just a long tweet, Paige Brown Jarreau asks:

Almost all scientists use both papers and meetings for communication. Tweets and blogs do not have that status; they could complement the informal discussions at meetings, but do differ in that everyone can read them, for all time. Social media will never be and should never be a substitute for the scientific literature.

Imagine that I had some preliminary evidence that the temperature increase since 1900 is nearly zero or that we may already have passed the two degree limit. I would love to discuss such evidence with my colleagues, to see if they notice any problems with the argumentation, to see if I had overlooked something, to see if there are better methods or data that would make the evidence stronger. I certainly would not like to see such preliminary ideas as a headline in the New York Times until I had gathered and evaluated all the evidence.

The problem with social media is that the boundaries between public and private are blurring. After talking about such a work at a conference, someone may tweet about it and before you know it the New York Times is on the telephone.

Furthermore, you always communicate with a certain person or audience and tailor your message to the receiver. When I write on my blog, I explain much more than when I talk to a colleague. Reversely, if someone hears or reads my conversation with a colleague this may be confusing because of the lack of explanation and give the wrong impression. In person at a conference a sarcastic remark is easily detected, on the written internet sarcasm does not work, especially when it comes to climate "debate" where there is no opinion too exotic.

This is not an imaginary concern. The OPERA team at CERN that found that neutrinos could travel faster than light got into trouble this way. The team was forced to inform the press prematurely because blogs started writing about their finding. The team made it very clear that this was still very likely a measurement error: “If this measurement is confirmed, it might change our view of physics, but we need to be sure that there are no other, more mundane, explanations. That will require independent measurements.” But a few months after the error was found, a stupid loose cable, the spokesperson and physics coordinator of OPERA had to resign. I would think that that would not have happened without all the premature publicity.

If I were to report that the two degree limit has already been reached, that the raw temperature data had a severe cooling bias, a multimedia smear campaign without comparison would start. Then I'd better have the evidence in my pocket. The OPERA example shows that even if you do not overstate your case, your job is in jeopardy. Furthermore, such a campaign would make further work extremely difficult, even in a country like Germany that has Freedom of Research in its constitution to prevent political interference with science:
Arts and sciences, research and teaching shall be free.
(Kunst und Wissenschaft, Forschung und Lehre sind frei)
This fortunate fact, for example, disallows FOIA harassment of scientists.

That openness is not necessary in the preliminary stages fits to the pivotal role of the scientific literature in science. In an article a scientist describes his findings in all the detail necessary for others to replicate it and build on it. That is the moment everything comes in the open. If the article is written well that is all one should need.

I hope that one day all scientific articles will be open access so that everyone can read them. I personally prefer to publish my data and code, if relevant, and would encourage all scientists to do so. However, how such a scientific article came into existence is not of anyone's business.

All the trivial and insightful mistakes that were made are not of anyone's business. And we need a culture in which people are allowed to make mistakes to get ahead in science. As a saying goes: if you are not wrong half of the time you are not pushing yourself enough to the edge of our understanding. By putting preliminary ideas in the limelight too soon you stifle experimentation and exploration.

In the beginning of a project I often request a poster to be able to talk about it with my most direct colleagues, rather than requesting a talk, which would broadcast the ideas to a much broader audience. (A secondary reason is that a well-organised poster session also provides much more feedback.) Once the ideas have matured a talk is great to tell everyone about it.

If a scientists chooses to show preliminary work before publication that is naturally fine. For certain projects the additional feedback my be valuable or even necessary as in case of collaboration with citizen scientists. And normally the New York Times will not be interested. However, we should not force people to work that way. It may not be ideal for every scientific question or person.

Opening up scientific meetings with social media and webcasts may intimidate (young) researchers and in this way limit discussion. Even at an internal seminar, students are often too shy to ask questions. On the days the professor is not able to attend, there are often much more questions. External workshops are even more intimidating, large conferences are even worse, and having to talk to a global audience because of social media is the worst of all.

More openness is not automatically more or better debate. It can stifle debate and also move it to smaller closed circles, which would be counter productive.

Personally I do not care much who is listening, as long as the topic is science I feel perfectly comfortable. The self-selected group of scientists that blogs and tweets probably feels the same. However, not everyone is that way. Some people who are much smarter than I am would like to first sharpen their pencils and think a while before they comment. I know from feedback by mail and at conferences that much more of my colleagues read this blog than I had expected because they hardly write comments. Writing something for eternity without first thinking about it for a few days, weeks or months is not everyone's thing. This is something we should take into account before we open informal communication up too much.

In spring I asked the organisers of a meeting how we should handle social media:
A question we may want to discuss during the introduction on Monday morning: Do people mind about the use of social media during the meeting? Twitter and blogs, for example. What we discuss is also interesting for people unable to attend the meeting, but we should also not make informal discussions harder by opening up to the public too much.
I was thinking about people saying in advance if they do not want their talk to be public and maybe we should also keep the discussions after the talks private, so that people do not have the think twice about the correctness of every single sentence.
The organisation kindly asked me to refrain from tweeting. Maybe that was the reply because they were busy and had never considered the topic. But that reply was fine by me. How appropriate social media are depends on the context and this was a small meeting, where opening it up to the world would be a large change in atmosphere.

I guess social media is less of a problem the general assembly of the European Geophysical Union (EGU), where you know that there is much press around. Especially for some of the larger sessions where there can be hundreds of scientists and some journalists in the audience. You would not use such large audiences to bounce some new ideas, but to explain the current state of the art.

Even EMS and EGU the organisation provides some privacy: it is officially not allowed to make photos of the posters. I would personally prefer that every scientist can indicate him or herself whether this is okay for his poster (and if you make rules, you should also enforce them).

Another argument against tweeting is that it distracts the tweeter. At last weeks EMS2014 there was no free Wi-Fi in the conference rooms (just in a separate working room). I thought that was a good thing. People were again listening to the talks, like in the past, and not tweeting, surfing or doing their email.

[UPDATE. Doug McNeall, the MetOffice guy that convinced me to start tweeting, has written a response on his blog.]

Related Reading

Letter to Science by Germán Orizaola and Ana Elisa Valdés: Free the tweet at scientific conferences

Kathleen Fitzpatrick (Director of Scholarly Communication) gives some sensible Advice on Academic Blogging, Tweeting, Whatever. For example: “If somebody says they’d prefer not to be tweeted or blogged, respect that” and “Do not let dust-ups such as these stop you from blogging/tweeting/whatever”.

I previously wrote about: The value of peer review for science and the press. It would be nice if the press would at least wait until a study is published. Even better would be to wait until several study have been made. But that is something we, as scientists, cannot control.

* Photo by Juan Emilio used with a Creative Commons CC BY-SA 2.0 licence.

Wednesday 8 October 2014

A framework for benchmarking of homogenisation algorithm performance on the global scale - Paper now published

By Kate Willett reposted from the Surface Temperatures blog of the International Surface Temperature Initiative (ISTI).

The ISTI benchmarking working group have just had their first benchmarking paper accepted at Geoscientific Instrumentation, Methods and Data Systems:

Willett, K., Williams, C., Jolliffe, I. T., Lund, R., Alexander, L. V., Brönnimann, S., Vincent, L. A., Easterbrook, S., Venema, V. K. C., Berry, D., Warren, R. E., Lopardo, G., Auchmann, R., Aguilar, E., Menne, M. J., Gallagher, C., Hausfather, Z., Thorarinsdottir, T., and Thorne, P. W.: A framework for benchmarking of homogenisation algorithm performance on the global scale, Geosci. Instrum. Method. Data Syst., 3, 187-200, doi:10.5194/gi-3-187-2014, 2014.

Benchmarking, in this context, is the assessment of homogenisation algorithm performance against a set of realistic synthetic worlds of station data where the locations and size/shape of inhomogeneities are known a priori. Crucially, these inhomogeneities are not known to those performing the homogenisation, only those performing the assessment. Assessment of both the ability of algorithms to find changepoints and accurately return the synthetic data to its clean form (prior to addition of inhomogeneity) has three main purposes:

1) quantification of uncertainty remaining in the data due to inhomogeneity
2) inter-comparison of climate data products in terms of fitness for a specified purpose
3) providing a tool for further improvement in homogenisation algorithms

Here we describe what we believe would be a good approach to a comprehensive homogenisation algorithm benchmarking system. Thfis includes an overarching cycle of: benchmark development; release of formal benchmarks; assessment of homogenised benchmarks and an overview of where we can improve for next time around (Figure 1).

Figure 1 Overview the ISTI comprehensive benchmarking system for assessing performance of homogenisation algorithms. (Fig. 3 of Willett et al., 2014)

There are four components to creating this benchmarking system.

Creation of realistic clean synthetic station data
Firstly, we must be able to synthetically recreate the 30000+ ISTI stations such that they have the correct variability, auto-correlation and interstation cross-correlations as the real data but are free from systematic error. In other words, they must contain a realistic seasonal cycle and features of natural variability (e.g., ENSO, volcanic eruptions etc.). There must be a realistic persistence month-to-month in each station and geographically across nearby stations.

Creation of realistic error models to add to the clean station data
The added inhomogeneities should cover all known types of inhomogeneity in terms of their frequency, magnitude and seasonal behaviour. For example, inhomogeneities could be any or a combination of the following:

- geographically or temporally clustered due to events which affect entire networks or regions (e.g. change in observation time);
- close to end points of time series;
- gradual or sudden;
- variance-altering;
- combined with the presence of a long-term background trend;
- small or large;
- frequent;
- seasonally or diurnally varying.

Design of an assessment system
Assessment of the homogenised benchmarks should be designed with the three purposes of benchmarking in mind. Both the ability to correctly locate changepoints and to adjust the data back to its homogeneous state are important. It can be split into four different levels:

- Level 1: The ability of the algorithm to restore an inhomogeneous world to its clean world state in terms of climatology, variance and trends.

- Level 2: The ability of the algorithm to accurately locate changepoints and detect their size/shape.

- Level 3: The strengths and weaknesses of an algorithm against specific types of inhomogeneity and observing system issues.

- Level 4: A comparison of the benchmarks with the real world in terms of detected inhomogeneity both to measure algorithm performance in the real world and to enable future improvement to the benchmarks.

The benchmark cycle
This should all take place within a well laid out framework to encourage people to take part and make the results as useful as possible. Timing is important. Too long a cycle will mean that the benchmarks become outdated. Too short a cycle will reduce the number of groups able to participate.

Producing the clean synthetic station data on the global scale is a complicated task that has now taken several years but we are close to completion of a version 1. We have collected together a list of known regionwide inhomogeneities and a comprehensive understanding of the many many different types of inhomogeneities that can affect station data. We have also considered a number of assessment options and decided to focus on levels 1 and 2 for assessment within the benchmark cycle. Our benchmarking working group is aiming for release of the first benchmarks by January 2015.

Wednesday 27 August 2014

A database with parallel climate measurements

By Renate Auchmann and Victor Venema


A parallel measurement with a Wild screen and a Stevenson screen in Basel, Switzerland. Double-Louvre Stevenson screens protect the thermometer well against influences of solar and heat radiation. The half-open Wild screens provide more ventilation, but were found to be affected too much by radiation errors. In Switzerland they were substituted by Stevenson screens in the 1960s.

We are building a database with parallel measurements to study non-climatic changes in the climate record. In a parallel measurement, two or more measurement set-ups are compared to each other at one location. Such data is analyzed to see how much a change from one set-up to another affects the climate record.

This post will first give a short overview of the problem, some first achievements and will then describe our proposal for a database structure. This post's main aim is to get some feedback on this structure.

Parallel measurements

Quite a lot of parallel measurements are performed, see this list for a first selection of datasets we found, however they have often only been analyzed for a change in the mean. This is a pity because parallel measurements are especially important for studies on non-climatic changes in weather extremes and weather variability.

Studies on parallel measurements typically analyze single pairs of measurements, in the best cases a regional network is studied. However, the instruments used are often somewhat different in different networks and the influence of a certain change depends on the local weather and climate. Thus to draw solid conclusions about the influence of a specific change on large-scale (global) trends, we need large datasets with parallel measurements from many locations.

Studies on changes in the mean can be relatively easily compared with each other to get a big picture. But changes in the distribution can be analyzed in many different ways. To be able to compare changes found at different locations, the analysis needs to be performed in the same way. To facilitate this, gathering the parallel data in a large dataset is also beneficial.

Organization

Quite a number of people stand behind this initiative. The International Surface Temperature Initiative and the European Climate Assessment & Dataset have offered to host a copy of the parallel dataset. This ensures the long term storage of the dataset. The World Meteorological Organization (WMO) has requested its members to help build this databank and provide parallel datasets.

However, we do not have any funding. Last July, at the SAMSI meeting on the homogenization of the ISTI benchmark, people felt we can no longer wait for funding and it is really time to get going. Furthermore, Renate Auchmann offered to invest some of her time on the dataset; that doubles the man power. Thus we have decided to simply start and see how far we can get this way.

The first activity was a one-page information leaflet with some background information on the dataset, which we will send to people when requesting data. The second activity is this blog post: a proposal for the structure of the dataset.

Upcoming tasks are the documentation of the directory and file formats, so that everyone can work with it. The data processing from level to level needs to be coded. The largest task is probably the handling of the metadata (data about the data). We will have to complete a specification for the metadata needed. A webform where people can enter this information would be great. (Does anyone have ideas for a good tool for such a webform?) And finally the dataset will have to be filled and analyzed.

Design considerations

Given the limited manpower, we would like to keep it as simple as possible at this stage. Thus data will be stored in text files and the hierarchical database will simply use a directory tree. Later on, a real database may be useful, especially to make it easier to select the parallel measurements one is interested in.

Next to the parallel measurements, also related measurements should be stored. For example, to understand the differences between two temperature measurements, additional measurements (co-variates) on, for example, insolation, wind or cloud cover are important. Also metadata needs to be stored and should be machine readable as much as possible. Without meta-information on how the parallel measurement was performed, the data is not useful.

We are interested in parallel data from any source, variable and temporal resolution. High resolution (sub-daily) data is very important for understanding the reasons for any differences. There is probably more data, especially historical data, available for coarser resolutions and this data is important for studying non-climatic changes in the means.

However, we will scientifically focus on changes in the distribution of daily temperature and precipitation data in the climate record. Thus, we will compute daily averages from sub-daily data and will use these to compute the indices of the Expert Team on Climate Change Detection and Indices (ETCCDI), which are often used in studies on changes in “extreme” weather. Actively searching for data, we will prioritize instruments that were much used to perform climate measurements and early historical measurements, which are more rare and are expected to show larger changes.

Following the principles of the ISTI, we aim to be an open dataset with good provenance, that is, it should be possible to tell were the data comes from. For this reason, the dataset will have levels with increasing degrees of processing, so that one can go back to a more primitive level if one finds something interesting/suspicious.

For this same reason, the processing software will also be made available and we will try to use open software (especially the free programming language R, which is widely used in statistical climatology) as much as possible.

It will be an open dataset in the end, but as an incentive to contribute to the dataset, initially only contributors will be able to access the data. After joint publications, the dataset will be opened for academic research as a common resource for the climate sciences. In any case people using the data of a small number of sources are requested to explicitly cite them, so that contributing to the dataset also makes the value of making parallel measurements visible.

Database structure

The basic structure has 5 levels.

0: Original, raw data (e.g. images)
1: Native format data (as received)
2: Data in a standard format at original resolution
3: Daily data
4: ETCCDI indices

In levels 2, 3 & 4 we will provide information on outliers and inhomogeneities.

Especially for the study of extremes, the removal of outliers is important. Suggestions for good software that would work for all climate regions is welcome.

Longer parallel measurements may, furthermore, also contain inhomogeneities. We will not homogenize the data, because we want to study the raw data, but we will detect breaks and provide their date and size as metadata, so that the user can work on homogeneous subperiods if interested. This detection will probably be performed at monthly or annual scales with one of the HOME recommended methods.

Because parallel measurements will tend to be well correlated, it is possible that statistically significant inhomogeneities are very small and climatologically irrelevant. Thus we will also provide information on the size of the inhomogeneity so that the user can decide whether such a break is problematic for this specific application or whether having longer time series is more important.

Level 0 - images

If possible, we will also store the images of the raw data records. This enables the user to see if an outlier may be caused by unclear handwriting or whether the observer explicitly wrote that the weather was severe that day.

In case the normal measurements are already digitized, only the parallel one needs to be transcribed. In this case the number of values will be limited and we may be able to do so. Both Bern and Bonn have facilities to digitize climate data.

Level 1 – native format

Even if it will be more work for us, we would like to receive the data in its native format and will convert it ourselves to a common standard format. This will allow the users to see if mistakes were made in the conversion and allows for their correction.

Level 2 – standard format

In the beginning our standard format will be an ASCII format. Later on we may also use a scientific data format such as NetCDF. The format will be similar to the one of the COST Action HOME. Some changes will be needed to the filenames account for multiple measurements of the same variable at one station and for multiple indices computed from the same variable.

Level 3 - daily data

We expect that an important use of the dataset will be the study of non-climatic changes in daily data. At this level we will thus gather the daily datasets and convert the sub-daily datasets to daily.

Level 4 – ETCCDI indices

Many people use the indices to the ETCCDI to study changes in extreme weather. Thus we will precompute these indices. Also in case government policies do not allow giving out the daily data, it may sometimes be possible to obtain the indices. The same strategy is also used by the ETCCDI in regions where data availability is scarce and/or data accessibility is difficult.

Directory structure

In the main directory there are the sub-directories: data, documentation, software and articles.

In the sub-directory data there are sub-directories for the data sources with names d###; with d for data source and ### is a running number of arbitrary length.

In these directories there are up to 5 sub-directories with the levels and one directory with “additional” metadata such as photos and maps that cannot be copied in every level.

In the level 0 and level 1 directories, climate data, the flag files and the machine readable metadata are directly in this directory.

Because one data source can contain more than one station, in the levels 2 and higher there are sub-directories for the various stations. These sub-directories will be called s###; with s for station.

Once we have more data and until we have a real database, we may also provide a directory structure first ordered by the 5 levels.

The filenames will contain information on the station and variable. In the root directory we will provide machine readable tables detailing which variables can be found in which directories. So that people interested in a certain variable know which directories to read.

For the metadata we are currently considering using XML, which can be read into R. (Are the similar packages for Matlab and FORTRAN?) Suggestions for other options are welcome.

What do you think? Is this a workable structure for such a dataset? Suggestions welcome in the comments or also by mail (Victor Venema & Renate Auchmann ).

Related reading

A database with daily climate data for more reliable studies of changes in extreme weather
The previous post provides more background on this project.
CHARMe: Sharing knowledge about climate data
An EU project to improve the meta information and therewith make climate data more easily usable.
List of Parallel climate measurements
Our Wiki page listing a large number of resources with parallel data.
Future research in homogenisation of climate data – EMS 2012 in Poland
A discussion on homogenisation at a Side Meeting at EMS2012
What is a change in extreme weather?
Two possible definitions, one for impact studies, one for understanding.
HUME: Homogenisation, Uncertainty Measures and Extreme weather
Proposal for future research in homogenisation of climate network data.
Homogenization of monthly and annual data from surface stations
A short description of the causes of inhomogeneities in climate data (non-climatic variability) and how to remove it using the relative homogenization approach.
New article: Benchmarking homogenization algorithms for monthly data
Raw climate records contain changes due to non-climatic factors, such as relocations of stations or changes in instrumentation. This post introduces an article that tested how well such non-climatic factors can be removed.

Sunday 24 August 2014

The Tea Party consensus on man-made global warming

Dan Kahan, Professor of Law and Psychology at Yale, produced a remarkable plot about the attitude towards global warming of Tea Party supporters.

Kahan of the Cultural Cognition Project is best known for his thesis that climate "sceptics" should be protected from the truth and that no one should mention the fact that there is a broad agreement (consensus) under climate scientists that we are changing the climate.

Without having the scientific papers to back it up, reading WUWT and Co. leaves one with the impression that there are many more scientific claims on climate change that would make these "sceptics" more defensive. They may actually be willing to pay not to hear them. We could use the money to stimulate renewable energy; to reduce air pollution in the West naturally, not for mitigation of global warming that would help everyone.

Tea Party

Maybe I should explain for the non-American readers that the Tea Party is a libertarian, populist and conservative political movement against taxes that gained prominence when the first "black" US president was elected.

It is well known that members of the Tea Party are more dismissive of global warming as the rest of the Republicans or Democrats in the USA. It could have been that Tea-Party members are "more Republican" as other people calling themselves Republican. The plot below by Dan Kahan suggests, however, that identifying with the Tea Party is an important additional dimension.

In fact, normal Republicans and democrats are not even that different. The polarization in the USA is to a large part due to the Tea Party. Especially, when you consider that the non-Tea-Party Republicans most to the right of the scale may still have a more tax-libertarian disposition than the ones more in the middle.

For me the most striking part is how sure Tea Party members claim to be that global warming is no problem. On average they see global warming as being a very low risk, the average is a one on a scale from seven to zero. Given how close that average is to the extreme of the scale, there cannot be that much variability. There thus probably is a consensus among Tea Party members that global warning is a low risk. That was something Kahan did not explicitly write in his post.

That is quite a consensus for a position without scientific evidence. I guess we are allowed to call this group think, given that many climate "sceptics" even call a consensus with evidence group think.


Related reading

Real conservatives are conservationists by Barry Bickmore (a conservative).
"The radical libertarians’ knee-jerk rejection of the scientific consensus on climate change isn’t just anti-Conservative. It borders on sociopathy in its extreme anti-intellectualism and recklessness."
The conservative family values of Christian man Anthony Watts
A post on the extremist and anti-intellectual atmosphere at WUWT and Co.
Planning for the next Sandy: no relative suffering would be socialist
Some people seem to be willing to suffer loses as long as others suffer more. This leads to the question: "Do dissenters like climate change?"

Monday 28 July 2014

Is the US historical network temperature trend too strong?

Climate dissenters often claim that the observed temperature trend is not only due to global warming, but for a large part due to local effects: due to increases in urbanization around the stations or somehow because of bad micro-siting.

A few days ago I had a twitter discussion with Ronan Connolly. He and his father claim that 0.2°C per century of the temperature increase in the USA is due to urbanization and 0.1°C per century is due to micro-siting. That is quite a lot. Together it would be almost half of the temperature trend seen in the main global datasets.


One of the great things of America is that they have a climate reference network (USRCN). The observations are normally made by the meteorologists and contain non-climatic effects that are not relevant for the meteorologists, but they are to climatologists. Thus to track accurately what is happening to the climate, NOAA has set up a climate reference network that follows high climatological standards. The main thing for this post is that these stations are located in pristine locations, without any problems with urbanization and micro-siting.

We only have data from this network starting in 2005. That is only a decade of data, but if the problems with the normal data are as large as Connolly claims, I thought we might be able to see some differences between the reference network and the normal US historical Climate Network (USHCN). In the USHCN non-climatic effects have been removed as well as possible with the pairwise homogenization algorithm (PHA) of NOAA.

The figure of NOAA below (in Fahrenheit) shows that USHCN (normal) and USRCN (reference) track each other quite closely. If you look at the details, you can see that actually the USRCH is a little below USHCN in the beginning and a little above at the end. In other words, the temperatures of the reference network are warming faster than those of the normal network. The opposite of what the climate dissenters would expect.


Let's have a more detailed look at the difference between the two networks in the following graph. It shows that the warming in the reference network was 0.09°C stronger per decade. For comparison with the trend due to global warming, you could also say that it is 0.9°C stronger per century. That is just as much as the observed global warming trend.


That the trend in the normal data is an underestimate of the true warming is no surprise for me. The trend of the raw American data has a strong cooling bias. Removing of non-climatic effects (homogenization) increases the temperature trend since 1880 by 0.4°C. We also know that homogenization can make trend estimates more reliable, but cannot fully remove the bias. Thus it was likely that there was a remaining cooling bias.

The cooling bias could be due to a number of effects. An important cooling bias in the USA is the transition of conventional observations with a cotton region shelter to automatic weather stations (maximum-minimum temperature systems). This transition is almost completed and was more intense in the previous century. Other biases could be the relocation of city stations to airports. This mainly took place before and during the second world war. The increased in interest in climate change may have increased interest in urbanization and micro-siting, which may thus have improved over time due to relocations. (Does anyone know any articles on that? I only know one for Austria.) There is also a marked increase in irrigation of gardens and cropland the last century.

That the effect is this strong is something we should probably not take seriously (yet). We only have nine values and thus a large uncertainty. In addition, homogenization is less powerful near the edges of the data, you want to detect changes in the mean and should thus be able to compute a mean with sufficient accuracy. As a consequence, NOAA does not adjust the last 18 month of the data, while half of the trend is due to the last two values. Still an artificial warming of USHCN, as the climate dissenters claim, seems highly unlikely.

This cooling bias is an interesting finding. Even if we should not take the magnitude too seriously, it shows that we should study cooling biases in the climate observations with much more urgency. The past focus on detecting climate change has led to a focus on warming biases, especially urbanization. Now that that problem is cleared, we need to know the best estimate of the climatic changes and not just the minimum estimate.

Maybe even more importantly, it shows that we need climate reference networks in every country. Especially to study climatic changes in extreme weather in daily station data, data that is much harder to homogenize than the annual means. We are performing a unique experiment with our global climate system. Future scientists will never forgive us if we do not measure what is happening as accurately as we can.

[UPDATE. In case anyone wants to analyse the "dataset", here it is:
diff = [0.017 0.050 0.022 0.017 0.022 0.017 -0.006 -0.039 -0.033]; % Difference USHCN-USRCN in °C
year = 2005:2013;
]

See also

Howard J. Diamond, Thomas R. Karl, Michael A. Palecki, C. Bruce Baker, Jesse E. Bell, Ronald D. Leeper, David R. Easterling, Jay H. Lawrimore, Tilden P. Meyers, Michael R. Helfert, Grant Goodge, Peter W. Thorne, U.S. Climate Reference Network after One Decade of Operations: Status and Assessment, Bulletin of the American Meteorological Society, 2013, 94, 4, 485, doi: 10.1175/BAMS-D-12-00170.1.

Tuesday 22 July 2014

Six sleep and jetlag tips

Bed time at the Hohenzollernbrücke Kölner Dom

Blogging has been light lately, I was at a workshop on statistics and homogenization in the USA. For me as old European this is another continent, 8 hours away. Thus I thought I'd share some jetlag tips, most of which are generally good sleeping tips as well. The timing is good: many people have trouble sleeping during the warm summer nights.

As far as I know, science does not really understand why we sleep. My guess would be: variability. Which is always my answer to stuff we do not understand. Most problems involving only the mean have been solved by now.

By doing the repairs and maintenance of your body at night, when there was not much else to do in the times before electrical light, you can allocate more energy to other stuff during the day and, for example, outrun someone who is repairing his cells all the time. Creating some variability in tasks between day and night thus seems to make evolutionary sense.

(The part I do not understand is why you have to lie down and close your eyes. Isn't is enough to simply rest? That seems to be so much less dangerous. But maybe the danger was not that large in bands where everyone has its own sleeping rhythm and someone is wake at most times.)

To differentiate between day and night, you need internal clocks to coordinate the action. Clocks that tell you to increase your cortisol in the hour before waking up, to get your body ready for action again. Clocks that tell you to reduce urine production during the night. Clocks that reduce the motility of your intestines while sleeping. Clocks that tell you to wind down and get ready for sleep in the evening. And so on.

These chemical clocks need to be synchronized, they do so mainly by light, but I have heard claims that also movement is signal for these clocks to keep track of the time. Without synchronization most people have an internal clock that runs one or more hours late and produces days that are longer than 24 hours. This natural period varies considerably. People who are night owls, most scientists for example, have longer internal days as early birds. I seem to be an extreme owl and can stay awake and concentrated all night. The rising sun is sometimes my last reminder that I really need to get to bed because otherwise my time becomes too much off with the rest of society.

1. Take your natural rhythm into account

Which brings me to tip 1. Or maybe experiment 1. For me as an owl, flying East is hard. It makes the day shorter and the days are already much too short for me anyway. In case of this last flight home, it made the day 8 hours shorter, not 24, but only 16 hours. Horror. Thus you have to go to bed well before you are tired and consequently cannot sleep.

My experiment was to stay awake during the flight. That made my day not 8 hours shorter, but 16 hours longer. Such a 40 hour day is probably too much for most, but given my natural long day, this seems to have worked perfectly for me. I hardly had any jetlag this time, almost like flying West, which also comes easy for me. I am curious what the experiences of others are. And can this trick be used by early birds flying West as well?

2. Light exposure

Light is vital for setting your internal clocks. Try and get as much sun as possible after your jetlag. Walk to work, take breaks outside, eat your meals outside, whatever is feasible. Often conferences are in darkened rooms, which mess up you clocks even without jetlag. Consider arriving early and spend your days before the conference outside.

Also on normal days, night owls should make sure that they get as much light exposure as possible and get outdoors early in the day to quickly tell your internal clock that it is day. It may help early birds to stay awake to seek the sun later in the day.

3. Artificial light

Artificial light, especially blue light, fools your internal clocks into thinking it is still day. If you do not become sleepy and have trouble getting to sleep, try to limit your exposure to artificial light in the evening. There are large differences in the color of the light between light bulb, select one that gives a nice warm glow and do not make the room too bright. The availability of artificial light is thought to have increased variability in sleeping times by making it easier for night owls to stay awake.

4. Blue glowing screens

Also monitors and smartphones give of a lot of blue light. I have f.lux installed on all my computers, it removes the blue light component from your monitor. I am not sure it helped me, but it cannot hurt in any way as long as the work you do is not color-sensitive. (If it sometimes it, you can easily turn it off.)

5. Pitch dark

Different Blindfolds for sleeping and resting
Make sure that your sleeping room is completely dark. This signals your clocks that it is night. Doing so improved the quality of my sleep a lot. They say this becomes more important as you age. Before putting blinders on your windows or hang up light blocking curtains, you can experiment and see if this is important for you by putting on a sleeping mask or simply lay a dark t-shirt over your eyes. (As an aside, also sleeping on a firm surface rather than a mattress improved the quality of my sleep I am curious whether other people have similar experiences.)

6. Sleep rhythm

The ideal nowadays is to sleep in one long period. This may be a quite recent invention to be able to use the evening productively using artificial light. Before people are thought to have slept a period after sunset, woke up for a few hours doing some stuff humans do and sleep another period. Even if this turns out not to be true, there is nothing wrong with sleeping in a few periods or with taking a nap. If you are awake, just get up, do something and try again later. I am writing this post in such a phase. Uncommon for me, probably due to the jetlag, I was tired at 8pm and slept two hours. When this post is finished, I will sleep the other 6 hours.

Related to this: try not to use an alarm clock. I realize this is difficult for most people due to social pressures. In this case you can set your alarm clock at a late time, so that you will often wake up before your alarm clock. Many people report waking up with gradually increasing light intensities is more pleasant, but also these devices are still an alarm clocks.

What do you think? Do you have any experience with this? Any more tips that may be useful?

Tuesday 8 July 2014

Understanding adjustments to temperature data

by Zeke Hausfather

There has been much discussion of temperature adjustment of late in both climate blogs and in the media, but not much background on what specific adjustments are being made, why they are being made, and what effects they have. Adjustments have a big effect on temperature trends in the U.S., and a modest effect on global land trends. The large contribution of adjustments to century-scale U.S. temperature trends lends itself to an unfortunate narrative that “government bureaucrats are cooking the books”.

Slide1

Figure 1. Global (left) and CONUS (right) homogenized and raw data from NCDC and Berkeley Earth. Series are aligned relative to 1990-2013 means. NCDC data is from GHCN v3.2 and USHCN v2.5 respectively.

Having worked with many of the scientists in question, I can say with certainty that there is no grand conspiracy to artificially warm the earth; rather, scientists are doing their best to interpret large datasets with numerous biases such as station moves, instrument changes, time of observation changes, urban heat island biases, and other so-called inhomogenities that have occurred over the last 150 years. Their methods may not be perfect, and are certainly not immune from critical analysis, but that critical analysis should start out from a position of assuming good faith and with an understanding of what exactly has been done.

This will be the first post in a three-part series examining adjustments in temperature data, with a specific focus on the U.S. land temperatures. This post will provide an overview of the adjustments done and their relative effect on temperatures. ...


Read more at Climate Etc.


(ht Hotwhopper)

Friday 27 June 2014

Self-review of problems with the HOME validation study for homogenization methods

In my last post, I argued that post-publication review is no substitute for pre-publication review, but it could be a nice addition.

This post is a post-publication self-review, a review of our paper on the validation of statistical homogenization methods, also called benchmarking when it is a community effort. Since writing this benchmarking article we have understood the problem better and have found some weaknesses. I have explained these problems on conferences, but for the people that did not hear them, please find them below after a short introduction. We have a new paper in open review that explains how we want to do better in the next benchmarking study.

Benchmarking homogenization methods

In our benchmarking paper we generated a dataset that mimicked real temperature or precipitation data. To this data we added non-climatic changes (inhomogeneities). We requested the climatologists to homogenize this data, to remove the inhomogeneities we had inserted. How good the homogenization algorithms are can be seen by comparing the homogenized data to the original homogeneous data.

This is straightforward science, but the realism of the dataset was the best to date and because this project was part of a large research program (the COST Action HOME) we had a large number of contributions. Mathematical understanding of the algorithms is also important, but homogenization algorithms are complicated methods and it is also possible to make errors in the implementation, thus such numerical validations are also valuable. Both approaches complement each other.


Group photo at a meeting of the COST Action HOME with most of the European homogenization community present. These are those people working in ivory towers, eating caviar from silver plates, drinking 1985 Romanee-Conti Grand Cru from crystal glasses and living in mansions. Enjoying the good live on the public teat, while conspiring against humanity.

The main conclusions were that homogenization improves the homogeneity of temperature data. Precipitation is more difficult and only the best algorithms were able to improve it. We found that modern methods improved the quality of temperature data about twice as much as traditional methods. It is thus important that people switch to one of these modern methods. My impression from the recent Homogenisation seminar and the upcoming European Meteorological Society (EMS) meeting is that this seems to be happening.

1. Missing homogenization methods

An impressive number of methods participated in HOME. Also many manual methods were applied, which are validated less because this is more work. All the state-of-the-art methods participated and most of the much used methods. However, we forgot to test a two- or multi-phase regression method, which is popular in North America.

Also not validated is HOMER, the algorithm that was designed afterwards using the best parts of the tested algorithms. We are working on this. Many people have started using HOMER. Its validation should thus be a high priority for the community.

2. Size breaks (random walk or noise)

Next to the benchmark data with the inserted inhomogeneities, we also asked people to homogenize some real datasets. This turned out to be very important because it allowed us to validate how realistic the benchmark data is. Information we need to make future studies more realistic. In this validation we found that the size of the benchmark in homogeneities was larger than those in the real data. Expressed as the standard deviation of the break size distribution, the benchmark breaks were typically 0.8°C and the real breaks were only 0.6°C.

This was already reported in the paper, but we now understand why. In the benchmark, the inhomogeneities were implemented by drawing a random number for every homogeneous period and perturbing the original data by this amount. In other words, we added noise to the homogeneous data. However, the homogenizers that requested to make breaks with a size of about 0.8°C were thinking of the difference from one homogeneous period to the next. The size of such breaks is influenced by two random numbers. Because variances are additive, this means that the jumps implemented as noise were the square root of two (about 1.4) times too large.

The validation showed that, except for the size, the idea of implementing the inhomogeneities as noise was a good approximation. The alternative would be to draw a random number and use that to perturb the data relative to the previously perturbed period. In that case you implement the inhomogeneities as a random walk. Nobody thought of reporting it, but it seems that most validation studies have implemented their inhomogeneities as random walks. This makes the influence of the inhomogeneities on the trend much larger. Because of the larger error, it is probably easier to achieve relative improvements, but because the initial errors were absolutely larger, the absolute errors after homogenization may well have been too large in previous studies.

You can see the difference between a noise perturbation and a random walk by comparing the sign (up or down) of the breaks from one break to the next. For example, in case of noise and a large upward jump, the next change is likely to make the perturbation smaller again. In case of a random walk, the size and sign of the previous break is irrelevant. The likeliness of any sign is one half.

In other words, in case of a random walk there are just as much up-down and down-up pairs as there are up-up and down-down pairs, every combination has a chance of one in four. In case of noise perturbations, up-down and down-up pairs (platform-like break pairs) are more likely than up-up and down-down pairs. The latter is what we found in the real datasets. Although there is a small deviation that suggests a small random walk contribution, but that may also be because the inhomogeneities cause a trend bias.

3. Signal to noise ratio varies regionally

The HOME benchmark reproduced a typical situation in Europe (the USA is similar). However, the station density in much of the world is lower. Inhomogeneities are detected and corrected by comparing a candidate station to neighbouring ones. When the station density is less, this difference signal is more noisy and this makes homogenization more difficult. Thus one would expect that the performance of homogenization methods is lower in other regions. Although, also the break frequency and break size may be different.

Thus to estimate how large the influence of the remaining inhomogeneities can be on the global mean temperature, we need to study the performance of homogenization algorithms in a wider range of situations. Also for the intercomparison of homogenization methods (the more limited aim of HOME) the signal (break size) to noise ratio is important. Domonkos (2013) showed that the ranking of various algorithms depends on the signal to noise ratio. Ralf Lindau and I have just submitted a manuscript that shows that for low signal to noise ratios, the multiple breakpoint method PRODIGE is not much better in detecting breaks than a method that would "detect" random breaks, while it works fine for higher signal to noise ratios. Other methods may also be affected, but possibly not in the same amount. More on that later.

4. Regional trends (absolute homogenization)

The initially simulated data did not have a trend, thus we explicitly added a trend to all stations to give the data a regional climate change signal. This trend could be both upward or downward, just to check whether homogenization methods might have problems with downward trends, which are not typical of daily operations. They do not.

Had we inserted a simple linear trend in the HOME benchmark data, the operators of the manual homogenization could have theoretically used this information to improve their performance. If the trend is not linear, there are apparently still inhomogeneities in the data. We wanted to keep the operators in the blind. Consequently, we inserted a rather complicated and variable nonlinear trend in the dataset.

As already noted in the paper, this may have handicapped the participating absolute homogenization method. Homogenization methods used in climate are normally relative ones. These methods compare a station to its neighbours, both have the same regional climate signal, which is thus removed and not important. Absolute methods do not use the information from the neighbours; these methods have to make assumptions about the variability of the real regional climate signal. Absolute methods have problems with gradual inhomogeneities and are less sensitive and are therefore not used much.

If absolute methods are participating in future studies, the trend should be modelled more realistically. When benchmarking only automatic homogenization methods (no operator) an easier trend should be no problem.

5. Length of the series

The station networks simulated in HOME were all one century long, part of the stations were shorter because we also simulated the build up of the network during the first 25 years. We recently found that criterion for the optimal number of break inhomogeneities used by one of the best homogenization methods (PRODIGE) does not have the right dependence on the number of data points (Lindau and Venema, 2013). For climate datasets that are about a century long, the criterion is quite good, but for much longer or shorter datasets there are deviations. This illustrates that the length of the datasets is also important and that it is important for benchmarking that the data availability is the same as in real datasets.

Another reason why it is important that the benchmark data availability to be the same as in the real dataset is that this makes the comparison of the inhomogeneities found in the real data and in the benchmark more straightforward. This comparison is important to make future validation studies more accurate.

6. Non-climatic trend bias

The inhomogeneities we inserted in HOME were on average zero. For the stations this still results in clear non-climatic trend errors because you only average over a small number of inhomogeneities. For the full networks the number of inhomogeneities is larger and the non-climatic trend error thus very small. It was consequently very hard for the homogenization methods to improve this small errors. It is expected that in real raw datasets there is a larger non-climatic error. Globally the non-climatic trend will be relatively small, but within one network, where the stations experienced similar (technological and organisational) changes, it can be appreciable. Thus we should model such a non-climatic trend bias explicitly in future.

International Surface Temperature Initiative

The last five problems will be solved in the International Surface Temperature Initiative (ISTI) benchmark . Whether a two-phase homogenization method will participate is beyond our control. We do expect less participants than in HOME because for such a huge global dataset, the homogenization methods will need to be able to run automatically and unsupervised.

The standard break sizes will be made smaller. We will make ten benchmarking "worlds" with different kinds of inserted inhomogeneities and will also vary the size and number of the inhomogeneities. Because the ISTI benchmarks will mirror the real data holdings of the ISTI, the station density and the length of the data will be the same. The regional climate signal will be derived from a global circulation models and absolute methods could thus participate. Finally, we will introduce a clear non-climate trend bias to several of the benchmark "worlds".

The paper on the ISTI benchmark is open for discussions at the journal Geoscientific Instrumentation, Methods and Data Systems. Please find the abstract below.

Abstract.
The International Surface Temperature Initiative (ISTI) is striving towards substantively improving our ability to robustly understand historical land surface air temperature change at all scales. A key recently completed first step has been collating all available records into a comprehensive open access, traceable and version-controlled databank. The crucial next step is to maximise the value of the collated data through a robust international framework of benchmarking and assessment for product intercomparison and uncertainty estimation. We focus on uncertainties arising from the presence of inhomogeneities in monthly surface temperature data and the varied methodological choices made by various groups in building homogeneous temperature products. The central facet of the benchmarking process is the creation of global scale synthetic analogs to the real-world database where both the "true" series and inhomogeneities are known (a luxury the real world data do not afford us). Hence algorithmic strengths and weaknesses can be meaningfully quantified and conditional inferences made about the real-world climate system. Here we discuss the necessary framework for developing an international homogenisation benchmarking system on the global scale for monthly mean temperatures. The value of this framework is critically dependent upon the number of groups taking part and so we strongly advocate involvement in the benchmarking exercise from as many data analyst groups as possible to make the best use of this substantial effort.


Related reading

Nick Stokes made a beautiful visualization of the raw temperature data in the ISTI database. Homogenized data where non-climatic trends have been removed is unfortunately not yet available, that will be released together with the results of the benchmark.

New article: Benchmarking homogenisation algorithms for monthly data. The post describing the HOME benchmarking article.

New article on the multiple breakpoint problem in homogenization. Most work in statistics is about data with just one break inhomogeneity (change point). In climate there are typically more breaks. Methods designed for multiple breakpoints are more accurate.

Part 1 of a series on Five statistically interesting problems in homogenization.


References

Domonkos, P., 2013: Efficiencies of Inhomogeneity-Detection Algorithms: Comparison of Different Detection Methods and Efficiency Measures. Journal of Climatology, Art. ID 390945, doi: 10.1155/2013/390945.

Lindau and Venema, 2013: On the multiple breakpoint problem and the number of significant breaks in homogenization of climate records. Idojaras, Quarterly Journal of the Hungarian Meteorological Service, 117, No. 1, pp. 1-34. See also my post: New article on the multiple breakpoint problem in homogenization.

Lindau and Venema, to be submitted, 2014: The joint influence of break and noise variance on the break detection capability in time series homogenization.

Willett, K., Williams, C., Jolliffe, I., Lund, R., Alexander, L., Brönniman, S., Vincent, L. A., Easterbrook, S., Venema, V., Berry, D., Warren, R., Lopardo, G., Auchmann, R., Aguilar, E., Menne, M., Gallagher, C., Hausfather, Z., Thorarinsdottir, T., and Thorne, P. W.: Concepts for benchmarking of homogenisation algorithm performance on the global scale, Geosci. Instrum. Method. Data Syst. Discuss., 4, 235-270, doi: 10.5194/gid-4-235-2014, 2014.