This is a guest post by Linden Ashcroft. She did her PhD studying non-climatic changes in the early instrumental period in Australia and now works at the homogenization power house, the Centre on Climate Change (C3) in Tarragona, Spain. She weekly blogs on homogenization and life in Spain.
This guest post was originally written for the Climanrecon blog. Climanrecon is currently looking at the non-climatic features of the Bureau of Meteorology’s raw historical temperature observations, which are freely available online. As Neville Nicholls recently discussed in The Conversation, the more the merrier!
Southeastern Australia is the most highly populated and agriculturally rich area in Australia. It’s home to our tallest trees, our highest mountains, our oldest pubs and most importantly, our longest series of instrumental weather observations. This makes southeastern Australia the most likely place to extend Australia’s instrumental climate record.
The official Australian Bureau of Meteorology was formed in 1908, bringing standard observing practices into effect across the country. Before this time, Australian weather station coverage was not as dense as today’s network, and there was no nationally-standard procedure for recording temperature.
The uncertain quality of the pre-1910 data and the lack of readily available information about observation techniques is why the current high-quality temperature dataset available for Australia does not begin until 1910. However, this does not mean that valuable observations were not taken in the 19th century, or that the spatial coverage of these data is too poor to be useful for studies of regional climate. Here, I explain what colleagues and I did to extend the temperature record of southeastern Australia.
When is the temperature not the temperature?
First of all, it’s important to know what ‘non-climatic’ influences can affect temperature observations. Some influences are fairly obvious: if you move a thermometer 20km down the road, change the time of day that the temperature is recorded, or replace the screen the thermometer is housed in, that will most likely cause changes in the data recorded at that station which are not caused by actual changes in the surrounding air.
Other non-climatic influences are more subtle. The slow growth of a tree next to a thermometer for example, or changes to the irrigation system in nearby paddocks can cause gradual changes to temperature observations that are not a reflection of the temperature in the wider area.

Three thermometer screens used in Adelaide, South Australia, in 1890: a Stevenson screen (left), a thermometer shed (centre), and a Glaisher stand (right). Charles Todd famously recorded the temperature in each of these screens for around 40 years, giving us invaluable information about the effect of different screens on temperature observations. Image: Meteorological Observations Made at the Adelaide Observatory, Charles Todd (1907).
Finding and reducing the impacts of these non-climatic influences is an important part of any climate change research. A multitude of statistical methods have been developed over the last 30 or so years to do this, ranging from the beautifully simple to the mind-bogglingly complex. Most of these methods rely on reference series, or a version of the truth with which you can compare data from the station you’re interested in. Reference series are often made using data from neighbouring weather stations that experience a similar climate. Of course this is much harder if you don’t have many neighbouring stations, or if a change in observation method happens at all stations at once! This is another reason why Australia’s national temperature record does not extend before 1910.
As well as these statistical tests, it’s also really useful to have information, or metadata, about the maintenance and changes that occur at a weather station. Metadata help you understand why a non-climatic influence might occur in the climate data, and how big it could be. In reality though, metadata can be hard to find.
Extending southeastern Australia’s temperature record
My work with the South Eastern Australian Recent Climate History project (SEARCH) set out to explore the quality and availability of climate data for Australia before 1908. Our aim was not to look at extreme events, or the exact temperature value at a particular location in a particular month, but to see how the average temperature across southeastern Australia varied over years and decades. This is important to note because if we were studying extremely hot months for example, or only the climate of Wagga, we might have used different methods.
The first step was looking for long-term temperature stations in southeastern Australia. Although the Bureau of Meteorology only started in 1908, a number of weather stations were set up in capital cities and key country towns from the late 1850s, thanks to the dedication of Australia’s Government Astronomers and Meteorologists
My colleagues and I also uncovered some sources of pre-1860 instrumental climate data for southeastern Australia that we painstakingly digitised and prepared for analysis. You can read more about that here.
Next, we spent a lot of time collecting information from the Bureau of Meteorology and previous studies about possible changes in station locations and other things that might affect the quality of the observational data. For some stations we found a lot of photos and details about changes to the area around a weather station. For others, particularly in the pre-1860 period, we didn’t find much at all.
After getting all this information and removing some outlying months, we tried to identify the non-climatic features of the temperature observations, and remove their influence. For the pre-1860 data this was particularly difficult, because we did not have a lot of metadata and there were no nearby stations to use as a ‘truth’. In the end we looked for large changes in the data that were supported by metadata and by the behaviour of other variables.
For example, a drop in temperature in the 1840s at some stations occurred at the same time as an increase in rainfall, suggesting that the temperature change was real, not due to some non-climatic influence. We also noted any other issues with the data, such as a bias towards rounding temperature values to the nearest even number (a common issue in early observations).
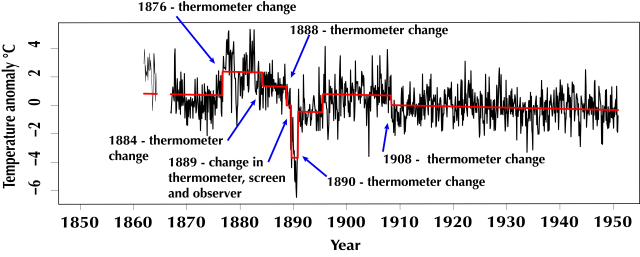
For the post-1860 data, we applied a 2-stage process of removing the non-climatic factors, using the statistical RHtest developed by members of the international Expert Team on Climate Change Detection and Indices (ETCCDI). The first stage looked for absolute non-climatic features: big jumps in the data that were clearly instrument problems or station changes, and that were supported by the metadata.
The second stage used reference series made from the average of data from up to five highly correlated neighbouring stations. Both stages involved carefully comparing the statistical results with the metadata we had, and making a decision on whether or not a non-climatic feature was present. You can read more about the methods here.

An example of the non-climatic features, or jumps, found in Newcastle maximum temperature data from 1860–1950 using the RHtest method. The supporting metadata are also shown. Image supplied by author.
So what did we find?
Our results for the 1860–1950 period found 185 non-climatic features in the maximum temperature data, and 190 in the minimum temperature data over the full network of 38 stations. Over 50% of these non-climatic features identified were supported by metadata, and most of them occurred from 1880 to 1900, when the thermometer shelters that were used in Australia were changed from Glaisher stands to Stevenson screens.
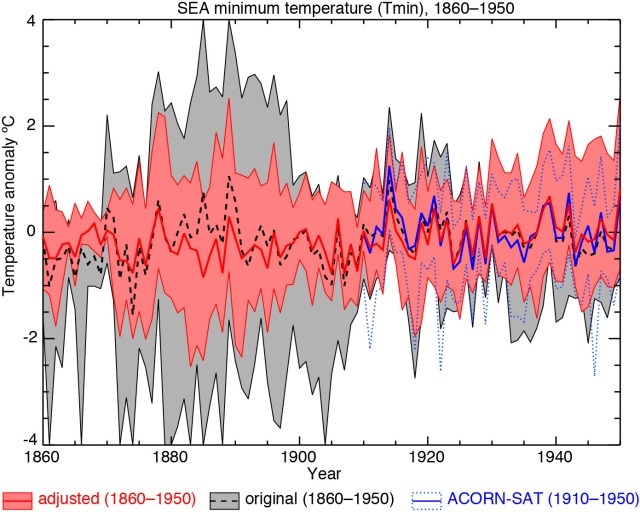
You can see in the figures below that removing the non-climatic features had a big impact on the variance of the observations, making the spread of temperatures across the region much more similar to the post-1910 period, when observations are more reliable. Our results also agreed very well with southeastern Australia data from the Bureau of Meteorology’s monthly and daily temperature datasets that have been tested for non-climatic features using different methods.
This good agreement allowed us to combine the area-average of my data with that of the Bureau’s best temperature dataset (ACORN-SAT), building a monthly temperature record for southeastern Australia from 1860 to the present. Combining the two series showed that the current warming trends in Australia are the strongest and most significant since at least 1860.

Area-averaged SEA annual anomalies (°C, relative to the 1910–1950 base period) of original data from the historical sources (1860–1950, dashed line), adjusted data from historical sources (1860–1950, solid red line) and data from ACORN-SAT, the Bureau of Meteorology’s daily temperature data over SEA (1910–1950, solid blue line) for maximum and minimum temperature over 1860–1950. The maximum and minimum anomalies for each year across the network are also plotted for the original historical data (grey shading with black outline), adjusted historical data (pink shading with red outline) and ACORN-SAT data (blue dotted lines). Adapted from Ashcroft et al. 2012.
The 1788–1860 data had some non-climatic influences as well, but these were much harder to untangle from the true climate signal because there is not as much ‘truth’ to compare to. We identified five clear non-climatic features of the pre-1860 temperature data from three stations, and found that the year-to-year temperature changes of the adjusted data matched up pretty well with rainfall observations, and newspaper reports at the time. The quality and distribution of the pre-1860 data made it impossible to accurately combine the pre- and post-1860 observations, but hopefully in the future we will uncover more observations and can look more closely at the 1788–1860 period.
Our work is one of the first projects to tackle Australia’s pre-1910 temperature data, shedding more light on Australia’s climatic past. This research also makes use of the hard work that was done by some of the country’s scientific pioneers, which is very rewarding to me as a scientist.
But science is always moving forwards, and our work is just one link in the chain. As more statistical methods are developed and additional data uncovered, I’m sure that we, professional and citizen scientists alike, will be able to build on this work in the future.
More information and references:
Ashcroft, L., Gergis, J. and Karoly, D.J., 2014. A historical climate dataset for southeastern Australia. Geosciences Data Journal, 1(2): 158–178, DOI: 10.1002/gdj3.19 (html and PDF). You can also access the 1788–1860 data at https://zenodo.org/record/7598.
Ashcroft, L., Karoly, D.J. and Gergis, J., 2012. Temperature variations of southeastern Australia, 1860–2011. Australian Meteorological and Oceanographic Journal 62: 227–245. Download here (PDF).

No comments:
Post a Comment
Comments are welcome, but comments without arguments may be deleted. Please try to remain on topic. (See also moderation page.)
I read every comment before publishing it. Spam comments are useless.
This comment box can be stretched for more space.