
Stevenson screen in Poland.
The main global temperature datasets show little or no warming in the land surface temperature and the sea surface temperature for the period between 1850 and 1920. I am wondering whether this is right or whether we do not correct the temperatures enough for the warm bias of screens that were used before the Stevenson screen was introduced. This transition mostly happened in this period.
This is gonna be a long story, but it is worth it. We start with the current estimates of warming in this period. There is not much data on how large the artificial cooling due to the introduction of Stevenson screens is, thus we need to understand why thermometers in Stevenson screens record lower temperatures than before to estimate how much warming this transition may have hidden. Then we compare this to the corrections NOAA makes for the introduction of the Stevenson screen. Also other changes in the climate system suggest there was warming in this period. It is naturally interesting to speculate what this stronger early warming may mean for the causes of global warming.
No global warming in main datasets
The figure below with the temperature estimates of the four main groups show no warming for the land temperature between 1850 and 1920. Only Berkeley and CRUTEM start in 1850, the other two later.If you look at the land temperatures plotted by Berkeley Earth themselves there is actually a hint of warming. The composite figure below shows all four temperature estimates for their common area for the best comparison, while the Berkeley Earth figure is interpolated over the entire world and thus sees Arctic warming more, which was strong in this period, like it again was strong in recent times. Thus there was likely some warming in this period, mainly due to the warming Arctic.

The temperature changes of the land according to the last IPCC report. My box.
In the same period the sea surface temperature was even cooling a little according to HadSST3 shown below.

The sea surface temperature of the four main groups and night marine air temperature from the last IPCC report. I added the red box to mark the period of interest.
Also the large number of climate models runs produced by the Coupled Model Intercomparison Project (CIMP5), colloquial called IPCC models, do not show much warming in our period of interest.

CMIP5 climate model ensemble (yellow lines) and its mean (red line) plotted together with several instrumental temperature estimates (black lines). Figure from Jones et al. (2013) with our box added to emphasize the period.
Transition to Stevenson screens
In early times temperature observations were often made in unheated rooms or in window screens of such rooms facing poleward. These window screens protected the expensive thermometers against the weather and increasingly also against direct sun light, but a lot of sun could get onto the instrument or the sun could heat the wall beneath the thermometer and warm air would rise up.
A Wild screen (left) and a Stevenson screen in Basel, Switzerland.
The more open a screen is, the better the ventilation, which likely motived earlier more open designs, but this also leads to radiation errors. In the end the Stevenson screen became the standard, which protects the instrument from radiation from all sides. It is made of white painted wood and has a measurement chamber mounted on a wood frame, it typically has a double board roof and double Louvred walls to all sides. Initially it sometimes did not have a bottom, but later had slanted boards at the bottom.
The first version [[Stevenson screen]] was crafted in 1864 in the UK, the final version designed in 1884. It is thought that most countries switched to Stevenson screens before 1920, but some countries were later. For example, Switzerland made the transition from Wild screens to Stevenson screens in the 1960s. The Belgium Station Uccle changed their half open shelter to a Stevenson screen in 1983. The rest of Belgium in the 1920s.

Open shelter (at the front) and two Stevenson screens (in the back) at the main office of the Belgium weather service in Uccle.
Radiation error
The schematic below shows the main factors influencing the radiation error. Solar radiation makes the observed maximum temperatures too warm. This can be direct radiation or radiation scattered via clouds or the (snow covered) ground. The sun can also heat the outside of a not perfectly white screen, which then warms the air flowing in. Similarly the sun can heat the ground, which then may radiate towards the thermometer and screen. However, the lack of radiation shielding also makes the minimum temperature too low when the thermometer radiates infrared radiation into the cold sky. This error is largest on dry cloudless nights and small when the sky radiates back to the thermometer, which happens when the sky is cloudy and the absolute humidity is high, which reduces the net infrared radiative cooling. The radiation error is largest when there is not much ventilation, which in most cases need wind. The direct radiation effects are smaller for smaller thermometers.
Schematic showing the various factors that can influence the radiation error of a temperature sensor.
From our understanding of the radiation error, we would thus expect the bias in the day-time maximum temperature to be large where the sun is strong, the wind is calm, the soil is dry and heats up fast. The minimum temperature at night has the largest cooling bias when the sky is cloudless and dry.
This means that we expect the radiation errors for the mean temperature to be largest in the tropics (strong sun and high humidity) and subtropics (sun, hot soil), while it is likely smallest in the mid and high latitudes (not much sun, low specific humidity), especially near the coast (wind). Continental climates are the question mark; they have dry soils and not much wind, but also not as much sun and low absolute humidity.
Parallel measurements
These theoretical expectations fit to the limited number of temperature differences found in the literature; see table below. For the mid-latitudes, David Parker (1994) found that the difference was less than 0.2°C, but his data mainly came from maritime climates in north-west Europe. Other differences found in the mid-latitudes are about 0.2°C (Kremsmünster, Austria; Adelaide, Australia; Basel, Switzerland). While in the sub-tropics we have one parallel measurement showing a difference of 0.35°C and the two tropical parallel measurements show have a difference of 0.4°C. We are missing information from continental climates.Table with the differences found for various climates and early screen1. Temperature difference in Basel is about zero using 3 fixed hour measurements to compute mean temperature, which was the local standard, but about 0.25 when using minimum and maximum temperature as is used most for global studies.
| Region | Screen | Temperature difference |
|---|---|---|
| North-West Europe | Various; Parker (1994) | < 0.2°C |
| Basel, Switzerland | Wild screen; Auchmann & Brönnimann (2012) | ˜0 (0.25)°C 1 |
| Kremsmünster, Austria | North-wall window screen; Böhm et al. (2010) | 0.2°C |
| Adelaide, South Australia | Glaisher stand; Nicholls et al. (1996) | 0.2°C |
| Spain | French screen; Brunet et al. (2011) | 0.35 °C |
| Sri Lanka | Tropical screen; in Parker (1994) | 0.37°C |
| India | Tropical screen; in Parker (1994) | 0.42°C |
Most of the measurements we have are in North West Europe and do not show much bias. However, theoretically we would not expect much radiation errors here. The small number of estimates showing large biases come from tropical and sub-tropical climates and may well be representative for large parts of the globe.
Information on continental climates is missing, while they also make up a large part of the Earth. The bias could be high here because of calm winds and dry soils, but the sun is on average not as strong and the humidity low.
Next to the climatic susceptibility to radiation errors also the designs of the screens used before the Stevenson screen could be important. In the numbers in the table we do not see much influence of the designs, but maybe we will see it when we get more data.
Global Historical Climate Network temperatures
The radiation error and thus the introduction of Stevenson screens affected the summer temperatures more than the winter temperatures. Thus it is interesting that the trend in winter is 3 times stronger in the (Northern Hemisphere, GHCNv3). In winter it is 1.2°C per century, in summer it is 0.4°C per century over the period 1881-1920; see figure below2.Also without measurement errors, the trend in winter is expected to be larger than in summer because the enhanced greenhouse effect affects winter temperatures more. In the CMIP5 climate model average the winter trend is about 1.5 times the summer trend3, but not 3 times.

Temperature anomalies in winter and summer over land in NOAA’s GHCNv3. The light lines are the data, the thick striped lines the linear trend estimates.
The adjustments made by the pairwise homogenization algorithm of NOAA for the study period are small. The left panel of the figure below shows the original and adjusted temperature anomalies of GHCNv3. The right panel shows the difference, which shows that there are adjustments in the 1940s and around 1970. The official GHCN global average starts in 1880. Zeke Hausfather kindly provided me with his estimate starting in 1850. During our period of interest the adjustments are about 0.1°C; a large part of which was before 1880.
These adjustments are smaller than the jump expected due to the introduction of the Stevenson screens. However, they should also be smaller because many stations will have started as Stevenson screens. It is not known how large percentage this is, but the adjustments seem small and early.

Other climatic changes
So far for the temperature record. What do other datasets say about warming in our period?Water freezing
Lake and river freeze and breakup times have been observed for a very long time. Lakes and rivers are warming at a surprisingly fast rate. They show a clear shortening of the freezing period between 1850 and 1920; the freezing started later and ice break-up started. The figure below shows that this was already going on in 1845.
Time series of freeze and breakup dates from selected Northern Hemisphere lakes and rivers (1846 to 1995). Data were smoothed with a 10-year moving average. Figure 1 from Magnuson et al. (2002).
Magnuson has updated his dataset regularly: when you take the current dataset and average over all rivers and lakes that have data over our period you get the clear signal shown below.

The average change in the freezing date in days and the ice break-up date (flipped) is shown as red dots and smoothed as a red line. The smoothed series for individual lakes and rivers freezing or breaking up is shown in the background as light grey lines.
Glaciers
Most of the glaciers for which we have data from this period show reductions in their lengths, which signals clear warming. Oerlemans (2005) used this information for a temperature reconstruction, which is tricky because glaciers respond slowly and are also influenced by precipitation changes.
Temperature estimate of Oerlemans (2005) from glacier data. (My red boxes.)
Proxies
Temperature reconstructions from proxies show warming. For example the NTREND dataset based on tree proxies from the Northern Hemisphere as plotted below by Tamino.
Temperature reconstruction of the non-tropical Northern Hemisphere.
[UPDATE. A new study estimates the year the warming started in temperature reconstructions from proxies and finds that this was around 1830.]
Paleo Model Intercomparison project
While the CMIP5 climate model runs did not show much warming in our period, the runs for the last millennium of the PMIP3 project do show some warming, although it strongly depends on the exact period; see below. The difference between CMIP5 and PMIP3 is likely that in the beginning of the 19th century there was much volcanic activity, which decreased the ocean temperature to below its equilibrium and it took some decades for it to return to its equilibrium. CMIP5 starts in 1850 and modelers try to start their models in equilibrium.
Simulated Northern Hemisphere mean temperature anomalies from PMIP3 for last millennium. CCSM4 shows the simulated Northern Hemisphere mean temperature anomalies (annual values in light gray, 30-yr Gaussian smoothed in black). For comparison various smoothed reconstructions (colored lines) are included which come from a variety of proxies, including tree ring width and density, boreholes, ice cores, speleothems, documentary evidence, and coral growth.
Sea surface temperature
Land surface warming is important for us, but does not change the global mean temperature that much. The Earth is a blue dot; 70% of our planet is ocean. Thus is we had a bias in the station data our period of 0.3°C, that would be a bias global temperature of 0.1°C. However, larger warming of land temperatures are difficult if the sea surface is not also warming and currently the data shows a slight cooling over our period. I have no expertise here, but wonder if such a large difference would be reasonable.Thus maybe we overlooked a source of bias in the sea surface temperature as well. It was a period in which sailing ships were replaced by steamships, which was a large change. The sea surface temperature was measured by sampling a bucket of water and measuring its temperature. During the measurement, the water would evaporate and cool. On a steamship there is more wind than on a sailing ship and thus maybe more evaporation. The shipping routes have also changed.
I must mention that it is a small scandal how few scientists work on the sea surface temperature. It would be about a dozen and most of them only part-time. Not only is the ocean 2/3 of the Earth, the sea surface temperature is also often used to drive atmospheric climate models and to study climate modes. The group is small, while the detection of trend biases in sea surface temperature is much more difficult than in station data because they cannot detect unknown changes by comparing stations with each other. The maritime climate data community deserves more support. There are more scientists working on climate impacts for wine; this is absurd.

A French (Montsouri) screen and two Stevenson screens in Spain. The introduction of the Stevenson screen went fast in Spain and was hard to correct using statistical homogenization alone. Thus a modern replica of the original French screen build for an experiment, which was part of the SCREEN project.
Causes of global warming
Let's speculate a bit more and assume that the sea surface temperature increase was also larger than currently thought. Then it would be interesting to study why the models show less warming. An obvious candidate would be aerosols, small particles in the air, which have also increased with the burning of fossil fuels. Maybe models overestimate how much they cool the climate.The figure from the last IPCC report below shows the various forcings of the climate system. These estimates suggest that the cooling of aerosols and the warming of greenhouse gases is similar in climate models until 1900. However, with less influence of aerosols, the warming would start earlier.
Stevens (2015) argues that we have overestimated the importance of aerosols. I do not find Stevens' arguments particularly convincing, but everyone in the field agrees that there are at least huge uncertainties. The CMIP5 figure gives the error bars at the right and it is within the confidence interval that there is effectively nearly no net influence of aerosols (ochre bar at the right).
There is direct cooling of aerosols due to scattering of solar radiation. This is indicated in red as "Aer-Rad int." This is uncertain because we do not have good estimates on the amount and size of the aerosols. Even larger uncertainties are in how aerosols influence the radiative properties of clouds, marked in ochre as "Aer-Cld int."
Some of the warming in our period was also due to less natural volcanic aerosols at the end. Their influence on climate is also uncertain because of lack of observations on the size of the eruptions and the spatial pattern of the aerosols.
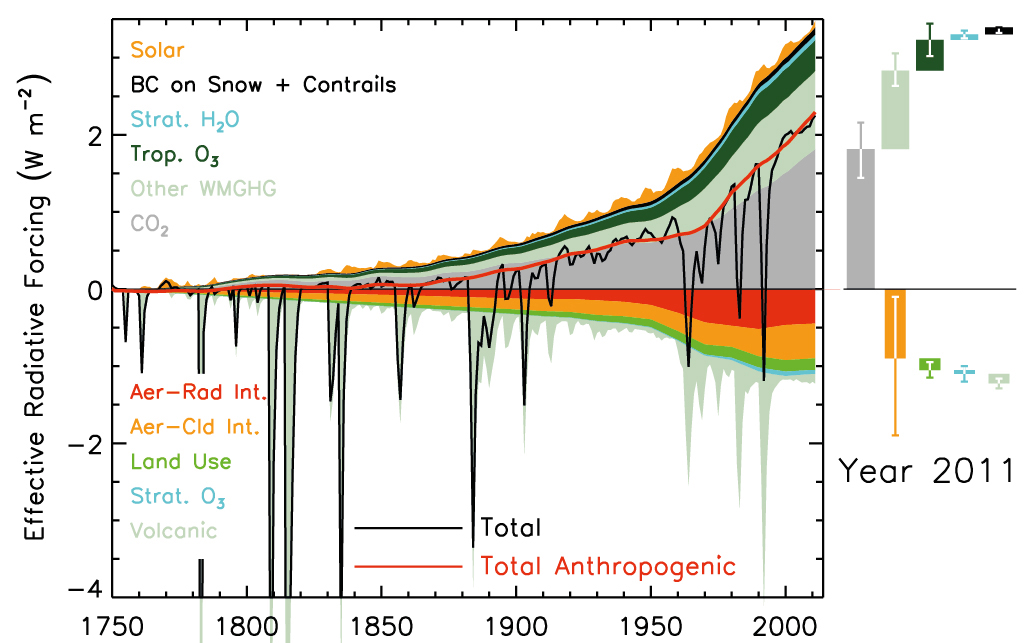
Forcing estimate for the IPPC AR5 report.
The article mentioned in the beginning (Jones et al. 2013) showing the CMIP5 global climate model ensemble temperatures for all forcings, which did not show much warming in our period, also gives results for model runs that only include greenhouse gases, which shows a warming of about 0.2°C; see below. If we interpret this difference as the influence of aerosols, (there is also a natural part) then aerosols would be responsible for 0.2°C cooling in our period in the current model runs. In the limit of the confidence interval were aerosols do not have a net influence, an additional warming of 0.2°C could thus be explained by aerosols.

CMIP5 climate model ensemble (yellow lines) and its mean (red line) plotted together with several instrumental temperature estimates (black lines). Figure from Jones et al. (2013) with our box added to estimate the temperature increase.
Conclusion on early global warming
Several lines of evidence suggest that the Earth’s surface actually was warming during this period. Every line of evidence by itself is currently not compelling, but the [[consilience]] of evidence at least makes a good case for further research and especially to revisit the warming bias of early instrumental observations.To make a good case, one would have to make sure that all datasets cover the same regions/locations. With the modest warming during this period, the analysis should be very careful. It would also need an expert for each of the different measurement types to understand the uncertainties in their trends. Anyone interested in make a real publishable study out of this please contact me.

Austrian Hann screen (a large screen build close to a northern wall) and a Stevenson screen in Graz, Austria.
Collaboration on studying the bias
To study the transition to Stevenson screens, we are collecting data from parallel measurements of early instrumentation with Stevenson screens.We have located the data for the first seven sources listed below.
Australia, Adelaide, Glaisher stand
Austria, Kremsmünster, North Wall
Austria, Hann screen in Vienna and Graz
Spain, SCREEN project, Montsouris (French) screen in Murcia and La Coruña
Switzerland, Wild screen in Basel and Zurich
Northern Ireland, North wall in Armagh
Norway, North wall
Most are historical datasets, but there are also two modern experiments with historical screens (Spain and Kremsmünster). Such experiments with replicas is something I hope will be done more in future. It could also be an interesting project for an enthusiastic weather observer with an interest in history.
From the literature we know of a number of further parallel measurements all over the world; listed below. If you have contacts to people who may know where these datasets are, please let us know.
Belgium, Uccle, open screen
Denmark, Bovbjerg Fyr, Skjoldnñs, Keldsnor, Rudkùbing, Spodsbjerg Fyr, Gedser Fyr, North wall.
France, Paris, Montsouris (French) screen
Germany, Hohenpeissenberg, North wall
Germany, Berlin, Montsouris screen
Iceland, 8 stations, North wall
Northern Ireland, a thermograph in North wall screen in Valentia
Norway, Fredriksberg observatory, Glomfjord, Dombas, North wall
Samoa, tropic screen
South Africa, Window screen, French and Stevenson screens
Sweden, Karlstadt, Free standing shelter
Sweden, Stockholm Observatory
UK, Strathfield Turgiss, Lawson stand
UK, Greenwich, London, Glaisher stand
UK, Croydon, Glaisher stand
UK, London, Glaisher stand
To get a good estimate of the bias we need many parallel measurements, from as many early screens as possible and from many different climatic regions, especially continental, tropical and sub-tropical climates. Measurements made outside of Europe are lacking most and would be extremely valuable.
If you know of any further parallel measurements, please get in touch. It does not have to be a dataset, also a literature reference is a great hint and a starting point for a search. If your twitter followers or facebook friends may have parallel datasets please post this post on POST.
Tweet
Related reading
Scientists clarify starting point for human-caused climate changeParallel Observations Science Team (POST) of the International Surface Temperature Initiative (ISTI).
The transition to automatic weather stations. We’d better study it now.
Why raw temperatures show too little global warming.
Changes in screen design leading to temperature trend biases.
Notes
1) The difference in Basel is nearly zero if you use the local way to compute the mean temperature from fixed hour measurements, but it is about 0.25°C if you use the maximum and minimum temperature, which is mostly used in climatology.
2) Note that GHCNv3 only homogenizes the annual means, that is, every month gets the same corrections. Thus the difference in trends between summer and winter shown in the figure is like it is in the raw data.
3) The winter trend is 1.5 times the summer trend in the mean temperature of the CMIP5 ensemble for the Northern Hemisphere (ocean and land). The factor three we found in for GHCN was only for land. Thus a more careful analysis may find somewhat different values.
References
Auchmann, R. and S. Brönnimann, 2012: A physics-based correction model for homogenizing sub-daily temperature series. Journal Geophysical Research Atmospheres., 117, art. no. D17119, doi: 10.1029/2012JD018067.Bjorn Stevens, 2015: Rethinking the Lower Bound on Aerosol Radiative Forcing. Journal of Climate, 28, pp. 4794–4819, doi: 10.1175/JCLI-D-14-00656.1.
Böhm, R., P.D. Jones, J. Hiebl, D. Frank, et al., 2010: The early instrumental warm-bias: a solution for long central European temperature series 1760–2007. Climatic Change, 101, pp. 41–67, doi: 10.1007/s10584-009-9649-4.
Brunet, M., J. Asin, J. Sigró, M. Bañón, F. García, E. Aguilar, J. Esteban Palenzuela, T.C. Peterson, P. Jones, 2011: The minimization of the screen bias from ancient Western Mediterranean air temperature records: an exploratory statistical analysis. International Journal Climatololgy, 31, 1879–1895, doi: 10.1002/joc.2192.
Jones, G. S., P. A. Stott, and N. Christidis, 2013: Attribution of observed historical near‒surface temperature variations to anthropogenic and natural causes using CMIP5 simulations. Journal Geophysical Research Atmospheres, 118, 4001–4024, doi: 10.1002/jgrd.50239.
Magnuson, John J., Dale M. Robertson, Barbara J. Benson, Randolf H. Wynne, David M. Livingstone, Tadashi Arai, Raymond A. Assel, Roger B. Barry, Virginia Card, Esko Kuusisto, Nick G. Granin, Terry D. Prowse, Kenton M. Stewart, and Valery S. Vuglinski, 2000: Historical trends in lake and river ice cover in the Northern Hemisphere. Science, 289, pp. 1743-1746, doi: 10.1126/science.289.5485.1743
Nicholls, N., R. Tapp, K. Burrows, and D. Richards, 1996: Historical thermometer exposures in Australia. International Journal of Climatology, 16, pp. 705-710, doi: 10.1002/(SICI)1097-0088(199606)16:6<705::AID-JOC30>3.0.CO;2-S.
Oerlemans, J., 2005: Extracting a Climate Signal from 169 Glacier Records. Science, 308, no. 5722, pp. 675-677, doi: 10.1126/science.1107046.
Parker, D.E., 1994: Effects of changing exposure of thermometers at land stations. International Journal Climatology, 14, pp. 1–31, doi: 10.1002/joc.3370140102.
Photo at the top a Stevenson screen of the amateur weather station near Czarny Dunajec, Poland. Photographer: Arnold Jakubczyk.
Photos of Wild screen and Stevenson screen in Basel by Paul Della Marta.
Photo of open shelter in Belgium by Belgium weather service.
Photo of French screen in Spain courtesy of SCREEN project.
Photo of Hann screen and Stevenson screen in Graz courtesy of the University of Graz.
There are lots of interesting (and for the non-specialist, unexpected) points and complications raised here.
ReplyDeleteI especially think that comparison measurements with historical instruments and enclosures taken side-by-side with modern high-precision PRT or thermistor-based temperature measurements in automated weather stations would be of significant value. Such data should be collected over at least a full year and ideally for two or more, and in a variety of climates.
Some of the early historical literature has details on the instrumentation used and the various issues that arose... the reports of the HMS Challenger expedition of the 1870s are a good example. But these don't seem to be abundant enough to be completely useful.
If there is a shortage of working historical meteorological instruments perhaps they could be accurately reconstructed, much the way some medieval warfare enthusiasts replicate historical longbows, crossbows and swords.
The WMO recommendation is to perform parallel measurements over several years when a change needs to be made to a measurement set-up. Unfortunately, this is not always done. If only because the reason the change needs to be made is not always known years in advance. Or politicians want to make budget cut NOW and install automatic weather stations and not pay for observers for several years more.
ReplyDeleteIt is an interesting task for weather enthusiasts to make parallel measurements. You can do it with modern equipment to study, for example, the influence of maintenance and painting. And someone with historical interests can study the kind of instruments and screens used in the past and build replicas.
Victor, thanks for an informative article! In Slovenia transition to Stevenson screen was a very slow process as some stations retained metal screens as late as in 1950s! On one side this is good for studying inhomogeneities, but on the other lack of stations during WW II make homogenisation a pretty though issue!
ReplyDeleteI agree there should bit a little bit of warming, however not more than 0.2 or 0.3 °C as the radiative forcing seeems to be weak compared to the last decades.
Maybe it should bo useful to inspect daily temperature range and see if there are any breaks. If maximum temperature is higher and minimum lower than I think the transition of screen could be well visible.
Victor,
ReplyDeleteA great read, thanks. I have a few thoughts which may be useful.
I think you're aware based on what's written later, but it's not flagged in the text that the Jones et al. model-obs comparison figure shows GHG-only historical runs, not all-forcing.
More importantly, the standard CMIP5 historical runs may not provide a good yardstick for this period because they are not initialised for the relatively extreme (volcanic) forcing conditions prior to the 1850 start date. Indeed, as far as I can tell, most models are not initialised for any volcanic forcing. This means there is probably less early historical warming in the models than there should be, relative to their individual forcing histories. Lack of volcanic initialisation also tends to result in oversized responses to the 1883 Krakatoa and other eruptions - it's a sort of shock to a previously docile system which results in an unrealistic step change in Earth's energy budget. Figure 1 in Gregory et al. 2013 illustrates both these issues. It's also evident in the historical ocean heat content plot from the recent Glecker et al. 2016 paper, in which there is a slight decline between 1880 and 1920.
There are a few model runs available which are initialised by forced millennial simulations from 850 to 1850. The ones I've found come from MPI-ESM-P, CCSM4 and GISS-E2-R. Unfortunately, all three seem to be quite limited with regards aerosol modelling, with fairly weak present day forcing.
On the influence of aerosols in the early period, I think it's important to consider that the trajectory of aerosol forcing over time is highly uncertain. All of the stated uncertainty you mention concerns present day forcing relative to 1750, or near-zero anthropogenic influence. There is no clear evidential basis for the shape of the aerosol forcing time series shown by the IPCC - it's simply based on a model driven by historical emissions inventories. Sulfate aerosol (or rather SO2) emissions inventories seem to be fairly reliable historically, though still quite uncertain as you go further back in time. But carbonaceous aerosol emission estimates prior to about 1950 seem to be little more than guesswork based on crude assumptions. In short, it's not at all inconceivable to me that present day aerosol forcing is around -1W/m2 while aerosol forcing change from 1880 to 1920 was slightly positive.
Another thing on aerosols - regardless of their net global average effect, they may be complicit in the lake/river freeze and glacier trends you show, via what's usually called the Black Carbon on snow effect. McConnell et al. 2007 find Black Carbon deposits in Greenland ice core layers which suggest a particularly large NH Extratropics increase between 1850 and 1920. This could have had substantial local effects on glaciers and lake/river ice without necessarily much effect at the global average scale. This was a conclusion of a 2013 paper (Painter et al.) focusing on the Alps.
Gregor, thank you. And thanks for the information on Slovenia. Do you also know when the transition to Stevenson screens started? And do you maybe have reference?
ReplyDeleteWe should gather this information for as many countries as we can get. Parker (1994) also already mentions several. With modern easier communication, I hope it will be possible to get this information for many more countries. A large problem may be that the people in many countries will have to dig into the archives to find such numbers.
I have no idea at which number for the bias of the early instrumental data we will end. We really need more data. I do think that 0.2 or 0.3°C are possible, but most likely it will be less. Especially because many stations will have started immediately with Stevenson screens.
There are many other reasons for cooling biases, which have hardly been studied at all, several of which are especially important for the recent period. For example, the transition to automatic weather stations, irrigation, transition to airports, better siting. Thus I would not draw conclusions from the recent period about the biases around 1900.
Paul Skeoch, thank you very, very much. That was a big mistake in the post. I had probably clipped the Jones et al. figure panel to use as an estimate for the influence of aerosols and then later thought it was a normal figure for all forcings. Have rewritten these parts of the post.
ReplyDeleteThis idea has been simmering in the background for a long time. Once in a while coming by new evidence and building a case. I heard about the volcanic activity and thus had a look at the PMIP results, which show some warming. That was probably the reason why I thought the Jones et al. panel looked like an all-forcing graph. I should have checked my early steps and seen the bad match at the end.
I had a short look at Black Carbon. Most of the evidence of early warming could potentially be influenced by it. Lake and river freezing, tree proxies from cold regions, glaciers, they are all quite white and could have an albedo feedback from BC.
I was impressed by the article I read about BC observations. They do not only have data from ice cores from polar regions, but also from many mountain glaciers. That seems to be a reasonable constraint. The influence of BC as a forcing is really small thus the estimates would need to be spectacularly off. Do you think there is that much room for errors?
You seem unaware that SST has already been heavily corrected for this period, precisely because of buckets, deck height and everything else. There was considerably more cooling in the raw data. Kennedy at al 2013 (a)(b)(c)
ReplyDeleteYou mention Böhm et al. (2010) and say you have the data for that.
Kremsmünster, Austria North-wall window screen; Böhm et al. (2010) 0.2°C
That is the HISALP data I presume. That could potentially be a very interesting dataset.
How much did it cost and did you have to sign a non disclosure agreement to get it?
If it is not covered by an NDA, I have been trying to get it for some time. Could you make it available somewhere? Or is this more Phil Jonesism, where they only give the data to non-critical reviewers.
Of course until it is open to unconditional review the findings of Böhm et al. are non verifiable and not science. Hopefully they have realised that by now.
Yes, I am aware of the SST work of John Kennedy (HadSST) and the ones of NOAA. He retweeted this post.
ReplyDeleteHadSST includes the type of bucket, as well as that can be estimated. I am not aware of different adjustments for sailing ships and motor ships. It could be that that has been studied already, I do not overview the SST literature. It was just an example.
No, I do not have the Kremsmünster data yet, but I know the person who has it, which is often the most difficult step. It takes quite some bureaucratic work to give out the data; the director of the weather service has to approve it.
I am in favor of sharing data. But science has existed before this became more common. Please tone down your shrill tone.
We plan to publish all the parallel datasets, if legally possible, together with our papers so that everyone can study them. Most organization are okay with that, they see parallel datasets as experimental data.
In one case we cannot publish the data data itself, but we can publish ETCCDI indices computed from them.
In one case we can only use 5 years of data; otherwise it would be seen as operational data and they are legally not allowed to give that out for free. Complain with your governments who try to make money without having to increase taxes, and not with the scientists who did not make these rules.
"I am not aware of different adjustments for sailing ships and motor ships. It could be that that has been studied already, I do not overview the SST literature. It was just an example."
ReplyDeleteWell it would be sensible to get at least a basic familiarity before suggesting that data may need correction. I recommend you read the papers I referred you to. A considerable amount of work has been done on this. You should probably regard SST of that period as a good guide, although many of the adjustments are guesswork and may not be totally right.
It is true that USA is much better than most european countries on access to govt. funded data.
Sorry for what you perceive as a "shrill attitude" but the HISTALP data was said to be freely available on their website .... until I asked for it. That is deceitful. Apparently some get to see it others don't. We are expected to blindly accept their research, even when no one can check their work.
There were obvious errors in the Bohm analysis but I was not able check what kind of difference it made. They just "correct" the data ( incorrectly ) and that is it. Even if I had paid and found something, I would not have been able to publish a meaningful correction since I would still have been bound by an NDA and my work would have had not more value than the original study.
That is not acceptable science practice.
That is unfortunate since there are some potentially uniquely long land records in HISALP but they have undergone very sizeable "adjustments". If you intend using them I suggest you make sure you get the original data and check what was done to them.
I have a "basic familiarity", thank you. That does not mean that I an confident to know every relevant paper in that field. And this is just a blog post, not a scientific article. Whether there is an error in SST in this period and what the reason for it is not central to this post. For an article I would have asked a knowledgeable colleagues to help me.
ReplyDeleteI read the Böhm paper and did not see those "obvious errors". Vague accusations are not what one would expect in science and severely weaken your holier than thou comments about how science is supposed to work.
If you have a specific problem, write a blog post about it with details. I will not post another comment of yours with vague accusations against a highly respected colleague who are unfortunately no longer with us to be able to defend himself. This is a blog where scientists should feel welcome. If you like a brawl go to WUWT.
Also a study whose data is only available with a NDA is perfectly valid. Both Böhm's and your theoretical study would be informative. You could point out where the errors are, how the computation should be made differently. The Austrians could respond to that and other researchers could also sign the NDA and check the computations themselves, something which should only be necessary in case of fraud, which is rare in the natural sciences. And anyone could make an experiment themselves. Science is not done by audit, but by independently contribution new knowledge.
The HISTALP dataset is freely available.
Only the parallel measurement in Kremsmünster is in the process of being approved to be available. This is work, negotiations with management and juridical departments. I can fully understand that the Austrians only do this when they think there is scientific value to this. Especially if you used the same tone as you do here.
Victor, no one was suggesting you should read every paper on the subject. But reading the principal papers from the authors that provide the dataset would seem to be a bare minimum. I imagine hope your knowledgeable colleagues would tell you the same thing.
ReplyDeleteI was not aware that Bohm is 'no longer with us'. That is not important to evaluating his work. Neither does that affect whether I find a fault in what he did. It is not his fault that the data is not available, my gripe is not with him but the data providers playing hide and seek with the data. Stating on their web site it is freely available when it is not ( they have since corrected the web site ).
Now if they are in the process of changing that situation, that is very welcome.
You say you cannot see the problem. Fine. Presumably you are not suggesting that does not mean there isn't one. That is the whole point of open, objective science. If and when they make data available I will be able to assess whether what I noticed makes a significant difference to the adjustments and make the results public. If it makes no significant difference it will be a validation of Bohm's efforts. For the moment that is totally lacking
Hopefully that will change.
"The HISTALP dataset is freely available."
ReplyDeletehttp://www.zamg.ac.at/histalp/dataset/station.php
"One example is the reduction of an “early instrumental warm bias” (Böhm et al., 2009 ) which significantly changed the long temperature hom-series from version 2007 to version 2008. "
"Austrian hom-station-mode-series are downloadable for non-profit research without restrictions. Hom-files from "
It is the "hom" data that is available, they will not release the raw data. That is obstructionism, not objective science. There is no commercial value in the raw data, it's only value is in scientific verification of the HOM data.
There are two long term adjustments of about 0.5K, that is a major adjustment that requires validation before any objective value can be accorded to the long term changes they show.
If you are interested in parallel data, cross-checking and detecting biases you need to be interested in this sort of issue.
While we should always assume that others are acting in good faith, we all have our own biases and blind-spots. That is why open scientific validation is a necessary part of science. The easiest person to fool is oneself !
That is not holier that thou, it is just the way the scientific method is supposed to work.
You say you cannot see the problem. Fine. Presumably you are not suggesting that does not mean there isn't one.
ReplyDeleteNo I am suggesting that your original claim that the problem was "obvious" is obviously wrong, as you now admit yourself by saying that you need the data to see if it is wrong.
There are two long term adjustments of about 0.5K, that is a major adjustment that requires validation before any objective value can be accorded to the long term changes they show. ... While we should always assume that others are acting in good faith, we all have our own biases and blind-spots.
If you argue that the adjustments need to be investigated because their influence on the network-wide trend are large, you do not assume good faith. Independent of the outcome, homogenization is important. You cannot know the result in advance. Not making any corrections when 0.5°C adjustments would be necessary is scientifically just as bad.
First the errors were "obvious", now you need data to be able to show them.
First HISTALP data was not available, now only the faulty raw data is not available.
Make up your mind if you want to be part of the political movement against science spreading doubt with faulty overconfident claims and unreasonable expectations or whether you want to contribute to science.
"First HISTALP data was not available, now only the faulty raw data is not available."
ReplyDeleteThe 'faulty raw data" IS the data. The rest are derivative time series. Hopefully they are better, they will certainly still contain biases. When the DATA is made available we may be able to VERIFY the processing that has been applied to it and possibly even improve it.
Verification is the cornerstone of the science. It is one of the things that distinguishes it from faith based systems like religion.
Assumptions of good faith does not imply the assumption on infallibility. That is reserved for his holiness the Pope.
There are so many things you can verify. You can compare the data to surrounding countries, you can check (a sample of) the raw data yourself (they are printed in yearbooks), you can compare with radiosondes, you can compare with the pressure profile, you can compare with reanalysis data, you can compare it with glaciers and biological data. Make a case, do not just spread doubt without any evidence whatsoever.
ReplyDeleteI would like things to be different, do petition the Austrian government. But it is ridiculous to immediately claim that science is a faith, there are many more cases where not all underlying raw data is available, for example for privacy concerns. There would be a lot of science that could not be done, a lot of things we would not understand, if science were forced to follow your rules. It gives the impression that you do not like the results and look for a stick to hit the messenger.
You do know that the Pope sees climate change as a serious problem, do you?
In the above post I make a case and all I do is ask for more research.
ReplyDeleteIn your comments, Greg, you do not make a case and immediately claim "obvious problems" and climatology to be a religion.
Notice the difference?
Goodness, you seem incapable of responding to anything without misquoting and distorting what I say and presuming bad faith, political motives or projecting your own biased attitudes onto me.
ReplyDeleteYou also chose not to publish my fuller comment highlighting this and providing what should be thought provoking critque of your post.
Where did I "claim climatology was a religion" ?
Where did I say adjustments needed "investigating" ? Those are your words not mine. You put words into my mouth by misquoting me then start to attack me for what YOU pretend I said.
"There are so many things you can verify...." which totally sidesteps my point about validation of science.
Verification by reproducing results is not to "spread doubt without any evidence whatsoever". It is to strengthen the results. It is the proper functioning of science and it is not "my rules", I did not invent the scientific method. I was just taught it. You seem to have missed that class.
"It gives the impression that you do not like the results and look for a stick to hit the messenger."
That is you implying my motives, again. You are the one assuming bad faith, not I. I'm not looking for a stick, I'm looking for DATA and by that I mean DATA not someone's secret, non verifiable rewriting of the data. Neither do I like or dislike the result. What I dislike is fairly massive adjustments that are locked behind a paywall and and NDA.
This has the potential to be a very useful long record but while they are playing hide and seek with the data it has no objective value.
I saw an error in Bohm's method. That is not a personal attack on the man, it is something that requires checking. You automatically interpret healthy scientific scepticism as "casting doubt". Scientists are supposed to "cast doubt" and to check each others work. Those who have a dog in the fight are the ones who object and get all defensive.
An objective scientist welcomes criticism and challenge because it strengthens his work. On my recent post at Climate Etc I said I was disappointed by the lack of credible challenges. I was not whining about being attacked.
Your replies here reveal more about your own attitudes than mine. Your unfounded assumptions about my motivations are little more than projections of your own.
You seem to have no problem "casting doubt" on the work of those who have taken considerable effort to prepare the land and SST temperature data. You have no problem targeting a selective part of the record that you "do not like" because it does not follow the GHG model closely enough.
You seem to think that you can estimate what the "true" warming should be by comparing to a GHG model run.
Your criticisms, my friend, are what is called projection.
Now go back and look at your post and decide for yourself whether you are being objective or trying to cast doubt on data that you do not "like".
That is not an attack, it is helpful, constructive advice.
Best regard, Greg.
Dear Mr. Goodman, all your comments have been published, except for the double one which you preceded with:
ReplyDelete"Victor, sorry this is a duplicate. There is no confirmation once I press publish comment. I don't know whether there is problem with the Gotcha thing. If dupe, just ignore."
You "saw an error", but are not able to provide any evidence for its existence. Something was apparently missing from your science class. In science we provide evidence for our statements and we carefully calibrate the strength of our claims by the amount of evidence we have.
>> You "saw an error", but are not able to provide any evidence for its existence.
ReplyDeleteSince the Austrian M.O. refuses to release their DATA I can hardly provide any evidence can I? That was not something missing in my science class. It is something missing from the data provider.
Neither do I even need to have pre-emptively spotted a methodological error to want to want to try to validate their processing by replication. Two separate 0.5K adjustments is huge. It is not necessarily wrong but requires checking.
I have not analysed their "hom" time series and have not even thought through which way the methodological error may affect the data. The data has no objective value unless such checks can be done. Until that is possible I will not waste time speculating what difference it makes nor try to compare the HISTALP data to anything else.
Since I'm not a catholic, I do not regard the Pope as infallible. Dr Böhm, auch nicht.
Hopefully they will soon release the parallel data from Kremsmünster and we can compare notes.
Best regards, Greg.
Feel free to want to audit the work of ZAMG for no reason, but I do not see it as appropriate to claim they made "obvious errors" when you do not present any evidence whatsoever in this long string of comments.
ReplyDeleteHi Victor,
ReplyDeleteThanks for the elaborated posting! Very interesting read! It’s been up a while already, but I shall reply better later than never anyways.
In fact, I’d like to expand a bit on Paul S(keoch)’s comment which covers all the important bits I was going to address already.
As far as I know, CMIP5 corrects for the missing volcanic imbalance by reducing the baseline temperature in 1850 by approx 0.2K (I might be wrong, but this is what I remember from some time back; can’t find the actual article or reference anymore). But it’s a very crude fix and not suited to make confident statements about the early warming.
However (as you know, Victor), I’ve managed to get hold of the majority of the available PMIP3 simulations that span until 2000 (unfortunately, many others end in 1850 which renders them essentially useless for our purpose here). This is the list: FGOALS, bcc-csm1-1, MPI-ESM-P, IPSL-CM5A-LR, CCSM4, CSIRO-Mk3, HadCM3, GISS-E2-R. I picked the best comparable CMIP5 version and this is the result: PMIP3 versus CMIP5
Blue CMIP5 and black PMIP3. All with reference to the 1901-1950 period). HadCM3 as the one model with several members that is entirely consistent in both experiments (I’m not sure yet this is the case for all the other models to 100%). Clearly, PMIP3 shows the expected stronger warming between 1900-1940. Also the “modern” warming is stronger as one would expect.
GISS-E2, CSIRO and even HadCM3 are reasonably credible with regard to aerosols. HadCM3 provides a NoAer experiment and the modern warming after 1970 would almost be 0.5K stronger, which is what I consider ballpark correct. The early warming (at least as far as the observations go) ma be slightly biased high in observations as higher latitudes are over-represented (the regions where BC warming was potentially very strong as of ice core evidence such as McConnell et al 2007). Models on the other hand may tend to underestimate the effect due to poor aerosol representation. This might even be true for those models that are more sensitive to aerosols in general. Absorption (especially ice albedo feedback) and reflection isn’t the same thing after all.
Anyways. I’ve tried to increase the level of sophistication in my 2Box-Energy Balance Model and tested 3 things: (a) slow and fast response starting 1500, (b) slow and fast response starting 1850, and (c) fast response only starting in 1850. This is the result for (a): EBM slow response starting 1500
(b): EBM slow response after 1850
and (c): EBM fast response only
Clearly, a variety of interesting features emerge that confirm the need to take ocean imbalance due to volcanoes into account. It should be mentioned, that the longest memory in my EBM is 200 years in case (a). While subtleties like a weaker Krakatoa response can’t be properly represented in an EBM, the gist is that only (a) reproduces observations reasonably well during the full 1850-2015 period. That alone does’t say much. The confidence comes when case (a) is compared with paleo-data and when we separate land/ocean and both hemispheres. I did all that, and I think I will write it up as a paper rather soonish. However, a bit more analysis has to be done before that.
Victor and Paul, let me know whether you wanna be involved. I’d love to have you on board as co-authors. Part 2 for Paul S in the next comment …
@Paul: At the moment, I’m looking at the sensitivity issue. First we can potentially draw more reliable conclusions about past eruptions (say past 500 years). Second, we can constrain the aerosol forcing more robustly as I tend to think that we can constrain the 1950-80 period rather well (i.e. we can only accommodate a fairly narrow range of aerosol forcing estimates if we don’t wanna mess up the correlation with observations). At the moment, it all boils down to the Agung eruption. Much seem to indicate that it had a rather low impact on the climate (more room for aerosol cooling instead). But then, the modern warming takes off a tad too quickly if I base my EBM on aerosol emissions only (BC/sulphates). I try to stick to emissions as I believe there’s no compelling argument for a strongly growing secondary effect which would counter the decreasing sulphate load after 1975. Only OC can change that picture to some extent. I should mention that I base my emissions on Klimont et al. 2013. As a reminder, here is how the individual forcing contributions in the EBM stack up: Forcing Function
ReplyDeleteAs you can tell from the three plots, the actual TCR range (dark = 2.5-3.5K ECS, light yellow 2-4K ECS with a TCR/ECS ratio of 0.57 as of CMIP5) isn’t very sensitive to the choice of the volcanic parameters. Same is true if I reduce the aerosol forcing by 25% and the ECS range by 0.5K (dark now 2-3K ECS, light blue 1.5-3.5K): EBM mid sensitivity
Little effect on the final TCR estimate, yet the modern warming is more in line with observation. None of the CMIP5s sees a reduction in aerosol forcing since 1970. It’s almost flat with the indirect effects increasing. Not sure why given that regional redistribution from EurAsia/NorthAmerica to Asia shouldn’t matter too much. Have to dig a bit deeper I guess. Your thoughts are highly appreciated. I know that AOD didn’t drop much over the last 15 years for example, particularly due to equatorial AOD increase, but little to work with.
Next thing on my list is to remove ENSO from observations to see how the earlier periods compare. Also, I’m gonna check OHC in NorESM1 and MIROC5 as they seem to represent southern ocean cooling best (and also happen to have a very sensible aerosol forcing). This way I wanna provide evidence that the TCR/ECS ratio I’ve chosen is sensible and in agreement with observations. Again, let me know what you think about collaboration. I would provide a more detailed outline of what I’ve done already and we could go from there …
So long for now … Best, KarSteN
Thanks Karsten, that is an expert reply any blogger dreams of. Would be very much interested in seeing the separate results for ocean and land. Given that the introduction of Stevenson screens would only affect the land temperatures, a focus on land would be important, while most studies give results for the ocean+land temperatures.
ReplyDeleteI was dreaming of one paper discussing all the different measurements showing warming and what that would mean for the models. But that is likely a too large study for one article. First studying the differences between CIMP and PMIP and the influence of aerosols on this period is likely smart. Count me in if you think I can contribute.
Well, spent quite some time now working on it ;) Thanks anyways!
ReplyDeleteThis is how land/ocean looks: EBM Land vs Ocean
Clearly, more warming in PMIP3 over land as well. The 2Box-EBM is doing a good job reproducing the differences. Same for the two hemispheres, with NH being better represented by observations I'd argue: EBM NH vs SH
The bottom panel shows the Greenland ice core data (grey) and the total anthropogenic aerosol emissions as of Skeie et al 2011 and Klimont et al 2013 is pictured in purple. The aerosol peak in the ice between 1900 and 1930 is mostly caused by BC, hence NH warming should be accelerated during this period ... as indeed it is. After the Novarupta/Katmai eruption (1912), temperatures between 30-90N went up by 0.5K within a matter of 20 years (1915-1935). No coincidence there! Oceans warmed as well due to volcanic recovery after another two major eruptions at the beginning (1902/1912) and a strong El Nino at the end (1939/40). But interestingly, oceans cooled pretty drastically between 1900-1912 in response to the two eruptions, while NH land (30-90N) barely cooled. That's in fact another indication that the BC forcing over higher NH land latitudes played a considerable role in driving some of the early warming (and countered the temporary volcanic cooling).
In terms of papers. I think that the EBM stuff and associated discussion of volcanic impacts is one paper. Focussing on the early warming period and the role of instrument errors (introduction of Stevenson screens) and Black Carbon emissions another really cool paper.
Hi Karsten,
ReplyDeleteThought this thread had been derailed so a bit late to the latter improved exchange.
I've never heard anything like a T adjustment at 1850. Tried a search but nothing came up. Gregory et al. 2013 did propose an adjustment method which was used in AR5 sea level budget tracking, but that's not included in the CMIP5 model output data. It may be that some modelling groups did something. Stefan Rahmstorf notes that his group (Echo-G I think) modelled with volcanic initialisation for CMIP3, but suggests this is not typical practice.
Forcing consistency in HadCM3 is a useful feature. I've found annoying inconsistencies between PMIP3 and CMIP5 runs in all other models. One problem is HadCM3 does not include black carbon, at least according to AR5 Chapter 12.
Should be an interesting study. If I can contribute in any way I'd love to be involved.
Hi Paul,
ReplyDeletehadn't checked back recently either (didn't even notice it derailed as I haven't read anything "Greg").
Thanks for checking back on a couple of issues I raised. Well, perhaps I came across the volcanic "adjustment" in some random paper that wasn't actually related to CMIP5. Difficult to recover such information if it only exists in your head ;)
I am pretty sure I will find many inconsistencies between the CMIP5 and PMIP3 versions of the models I've been using. Welcomed indeed that HadCM3 seems consistent. There is a HadCM3 version that includes BC, but I guess this isn't the case for these simulations in agreement with the CMIP5 version.
I'm happy to hear that you wanna be involved too. I'll keep you both up-to-date-then. Didn't make progress in the last 2-3 weeks as project related work had to be done. Hope to continue soon.