
This week we had the first meeting of the new Task Team on Homogenization of the Commission for Climatology. More on this later. This meeting was at the headquarters of the World Meteorological Organization (WMO) in Geneva, Switzerland. I naturally went by train (only 8 hours), so that I could write about scientists flying to meetings without having to justify my own behaviour.
The WMO naturally had to display meteorological instruments in front of the entrance. They are not exactly ideally sited, but before someone starts screaming: the real observations are made at the airport of Geneva.
What was fun for me to see was that they tilted their ceilometer under a small angle. In the above photo, the ceilometer is the big white instrument on the front right of the lodge. A ceilometer works by the same principle as a radar, but it works with light and is used to measure the height of the cloud base. It sends out a short pulse of light and detects how long (short) it takes until light scattered by the cloud base returns to the instrument. The term radar stands for RAdio Detection And Ranging. A ceilometer is a simple type of lidar: LIght Detection And Ranging.
For my PhD and first postdoc I worked mostly on cloud measurements and we used the same type of ceilometer, next to many other instruments. Clouds are very hard to measure and you need a range of instruments to get a reasonable idea of how a cloud looks like. The light pulse of the ceilometer extinguishes very fast in a water cloud. Thus just like we cannot see into a cloud with our eyes, the ceilometer cannot do much more than detect the cloud base.
We also used radars, the radiowaves transmitted by a radar are only weakly scattered by clouds. This means that the radio pulses can penetrate the cloud and you can measure the cloud top height. Radiowaves, however, scatter large droplets much much stronger than small ones. The small freshly developed cloud droplets that are typically found at the cloud base are thus often not detected by the radar. Combining both radar and lidar, you can measure the cloud extend of the lowest cloud layer reasonably accurately.
You can also measure the radiowaves emitted by the atmosphere with a so-called radiometer. If you do so at multiple wavelengths that gives you an idea of the total amount of cloud water in the atmosphere, but it is hard to say at which height the clouds are, but we know that from the lidar and radar. If you combine radar, ceilometer and radiometer, you can measure the clouds quite accurately.
To measure very thin clouds, which the radiowave radiometer does not see well, you can add an infra-red (heat radiation) radiometer. Like the radar, the infra-red radiometer cannot look into thick clouds, for which the radiowave radiometer is thus important. And so on.
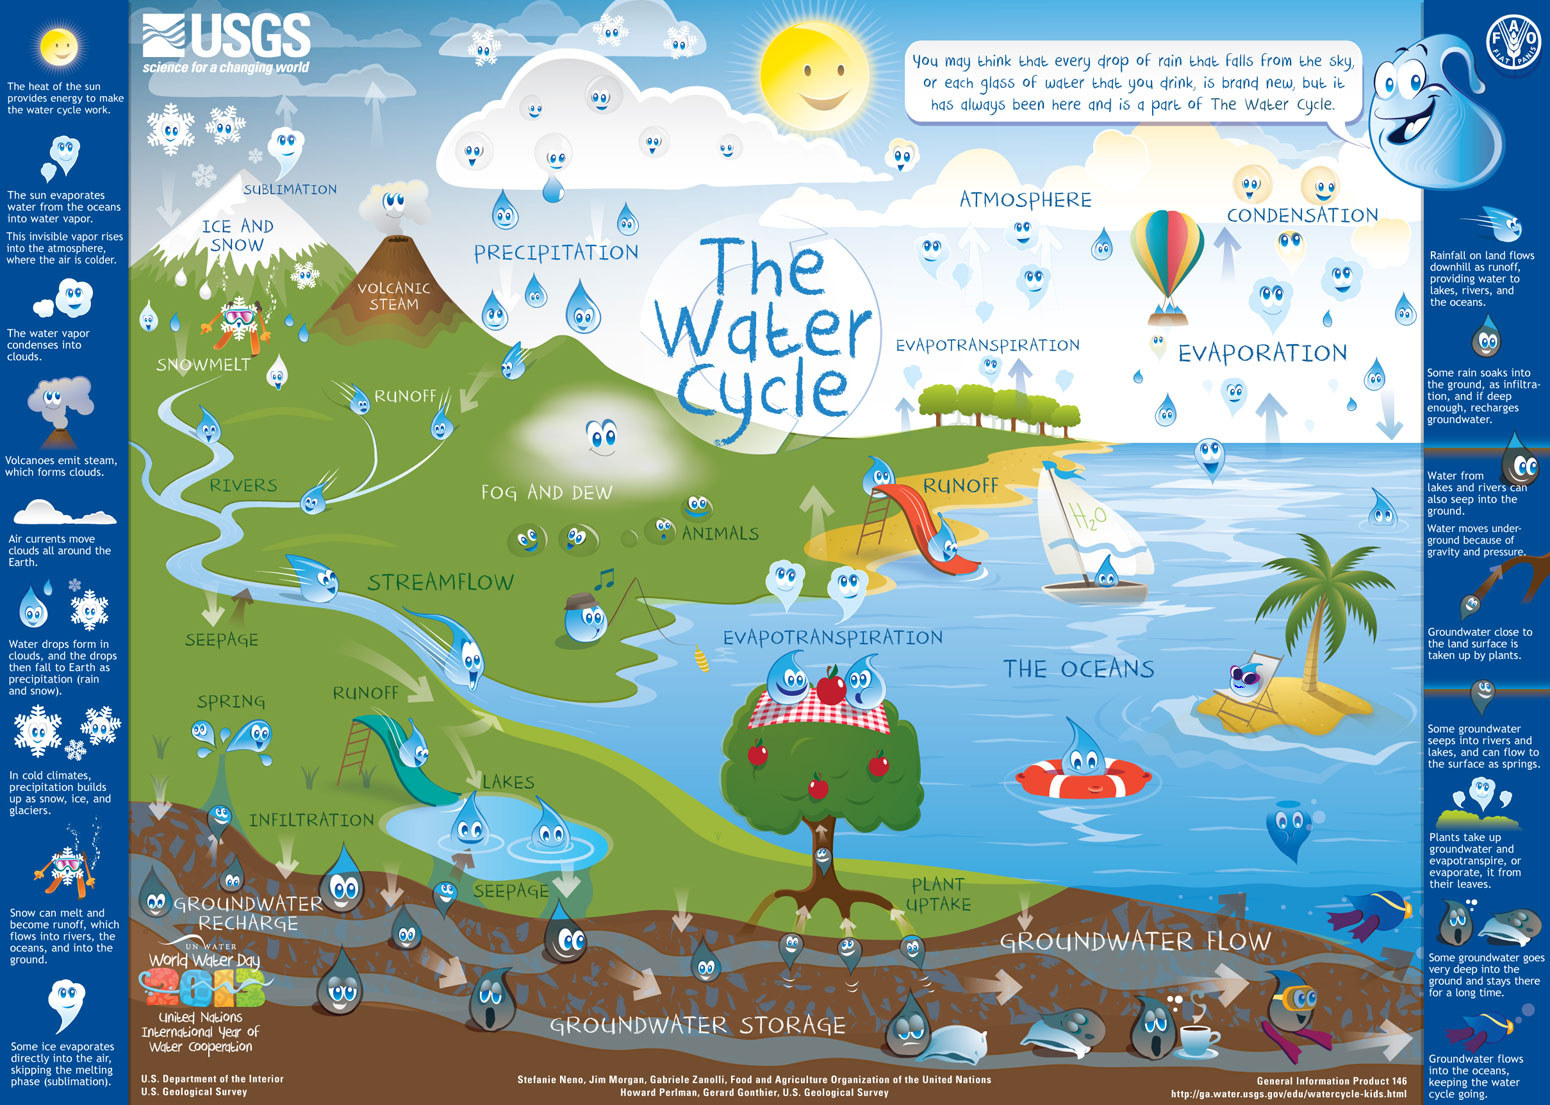
Cheery tear drops illustrate the water cycle for kids. You may think that every drop of rain that falls from the sky or each glass of water that you drink, is brand new, but it has always been here and is part of the The Water Cycle.

If a lidar is pointed vertically, it will measure the light reflected back by the flattened base of the rain drops. When their base is flat, drops will reflect almost like a mirror. If you point the lidar at an angle, the surface of the drop will be rounder and the drop will reflect the light in a larger range of directions. Thus the lidar will measure less reflected light coming back from rain drops when it is tilted. Because the aim of the ceilometer is to measure the base of the cloud, it helps not to see the rain too much. That improves the contrast.
I do not know if anyone uses lidar to estimate the rain rate, there are better instruments for that, but even in that case, the small tilt is likely beneficial. It makes the relationship between the rain rate and the amount of back scattered light more predictable, because it depends less on the drop size.
The large influence of the tilting angle of the lidar can be seen in the lidar measurement below. What you see is the height profile of the amount of scattered light for a period of about an hour. During this time, I have changed the titling angle of the lidar every few minutes to see whether this makes a difference. The angle away from the vertical in degrees is written near the bottom of the measurement. In the rain, below 1.8 km, you can see the above explained effect of the tilting angle.

The lidar backscatter (Vaisala CT-75K) in the rain as a function of the pointing angle (left). The angle in degrees is indicated by the big number at the bottom (zenith = 0). The right panel shows the profiles of the lidar backscatter, radar reflectivity (dBZ), and radar velocity (m/s) from the beginning (till 8.2 hrs) of the measurement. For more information see this conference contribution.
In the beginning of the above measurement (until 8.2h), you can see a layer with only small reflections at 1.8 km. This is the melting layer where snow and ice melts into rain droplets. Thus the small reflections you see between 2.5 and 2 km are the snow falling from the cloud, which is seen as a strong reflection at 2.5 km.
An even more dramatic example of a melting layer can be seen below at 2.2 km. The radar sees the melting layer as a strongly reflecting layer, whereas the melting layer is a dark band for the lidar.
 |  |
The snow reflects the light of the lidar stronger than the melting particles. When the snow or ice particle melts into rain drops, they become more transparent. Just watch a snowflake or hailstone melt in your hand. Snowflakes, furthermore, collapse and become smaller and the number of particles per volume decreases because the melted particles fall faster. These effects reduce the reflectivity in the top of the melting layer where the snow melts.
What is still not understood is why the reflectivity of the particles increases again below the melting layer. I was thinking of specular reflections by the flat bottoms of the rain drops, which develop when the particles are mostly melted and fall fast. However, you can also see this increase in reflections below the melting layer in the tilted lidar measurements. Thus specular reflections cannot explain it fully.
Another possible explanation would be if the snowflake is very large, the drop it produces is too large to be stable and explodes in many small drops. This would increase the total surface of the drops a lot and the amount of light that is scattered back depends mainly of the surface. This probably does not happen so explosively in nature as in the laboratory example below, but maybe it contributes some.

To be honest, I am not sure whether we were the first ones to tilt the lidar to see the cloud base better. It is very well possible that the instrument can be tilted like for this purpose. But if we were and the custom spread all the way the WMO headquarters, it would be one of the many ideas and tasks academics perform that does not lead to more citations or a better [[Hirsch index]]. These citations are unfortunately the main way in which managers and bureaucrats nowadays measure scientific output.
For my own publications, which I know best, I can clearly say that if I rank them for my own estimate of how important they are, you will get a fully different list than when you rank them for the number of citations. These two ranked lists are related, but only to a small degree.
The German Science Foundation (DFG) thus also rightly rejects in its guidelines on scientific ethics the assessment of individuals or small groups by their citation metrics (page 22). When you send a research proposal to the DFG you have to indicate that you read these guidelines. I am not sure whether all people involved with the DFG have read the guidelines, though.
Tweet
Further information
A collection of beautiful remote sensing measurements.On cloud structure. Essay on the fractal beauty of clouds and the limits of the fractal approximation.
Wired: Should We Change the Way NSF Funds Projects? Trust scientists more. Science is wasteful, if we knew the outcome in advance, it would not be science.
On consensus and dissent in science - consensus signals credibility.
Peer review helps fringe ideas gain credibility.
Are debatable scientific questions debatable?
* Cartoon of tear shaped rain drop by USGS. The diagram of raindrop shapes is from NASA’s Precipitation Measurement Missions. Both can thus considered to be in the U.S. public domain.
